How to Test Transistors and FETs
To test transistors and FETs, we use the Tektronix 571 Curve Tracer.
Setting up the Curve Tracer
First thing you need to do is determine which pin your emitter, collector, and base are if you are testing a transistor, or if you are testing a FET which pins are gate, source and drain. You then insert the component you are testing into the proper slot on the curve tracer making sure each pin is going in its designated location. Once the component is properly inserted into the Curve Tracer there is a cover you can slide over the device, just in case because the components can get very hot during testing.
Getting the Settings Right
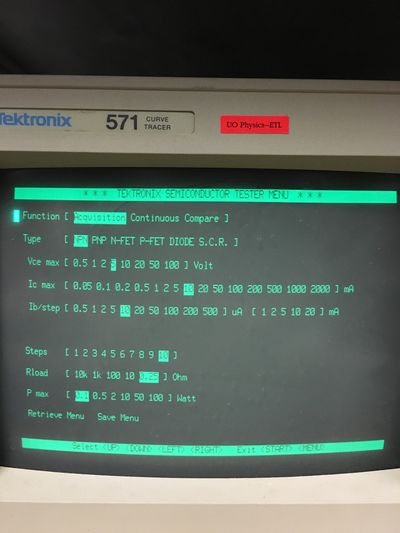
Once you have properly inserted the component you are testing, you can turn on the Curve Tracer. Once booted up, the curve tracer will come up with a menu.


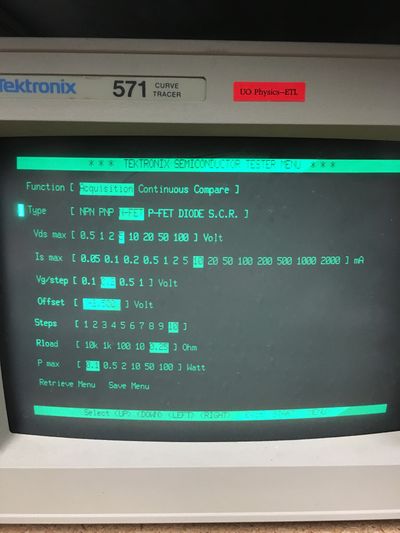
The first step on the menu is to tell the machine which type of device you are testing. For a transistor you have to know if it is PNP or NPN, and for a FET you have to know if it is an N-FET or P-FET. If you do not know this information you can easily find it by looking up the components data sheet. After you choose which device you have the menu may change a little. The options for a transistor are slightly different than those for a FET.
Starting with the transistor, the first two settings are the voltage from collector to emitter max and the max current you want to send to the collector. These values you can find on your components datasheet. To be safe, you can generally set the maximums a little less than what the datasheet maximum is and still get great results. Next is the step up in the current you are supplying to the base and the amount of steps you want. The best method is to start at 200 microAmps and test it and if you don't get any results go up to the next highest and so on (unless of course you reach the maximum base current the device can handle which can be found on the datasheet). The steps setting can be set at 10 unless you are working with a really high current step and you are worried about reaching the maximum current the base of your device can handle. For Rload that can either be set at .25 or 10, too much resistance will cause no results to appear. P max is something that again can be calculated through values on the datasheet, for most smaller transistors use 2 Watts. Once all of these settings are inputted you are ready to test.
Now for the FET, the process is very similar, but some of the settings are a little different. For the FET, the first two options are the max voltage through the drain and source and the max current through the source. These, like with the transistor can be found on the devices datasheet. Again, for safety purposes it is smart to put the maximums a little less than what the datasheet says, just not low enough that it will affect your test. Next is the step voltage for the gate, usually set at either .2 or .5 unless you plan on having the FET handle very high voltages in whatever you are using it for (in that case the step could be a little larger). After that is the gate voltage offset which can be set at or near 0. The final three settings are the exact same as they were for the transistor and can be set the same way except that the power max can be higher because FETs are designed to handle more power. Now it is time to run the test.
Getting Results
Once all of your settings are correct, press the start button to run the machine. When you do this, a graph will appear and start tracing curves.
Above are the results you hope to see from a transistor and a FET. NPN and PNP transistors should have similar looking graphs when compared to each other, and the same
thing for N-FETs and P-FETs. Sometimes on the FET graph more than one curve will appear of the shape shown. That is not a problem, it is not like the transistor where all
of the lines are close together and seemingly heading in the same direction. A big part of this is guess and check. There are no exact settings that work every time for
every device. If on the first run, the graphs don't look like the ones above, go back and change the settings a little bit and check it again. If you are still having troubles
getting the graphs to look like those above, test another component of the same type. If the graphs look the same, then both components are probably good. If they are different,
then one is broken and you can use a third component of the same type and do the same test to see which is broken.


