Astronomical Spectroscopy
Astronomical Spectroscopy Project
Astronomical Spectroscopy Web Page
The overall goal of the Astronomical Spectroscopy Project is to be able to collect and reduce data gathered from astronomical objects. Before spectra can be collected, the system needs to be prepared. This preparation involves aligning the telescope-fiber system and calculating the efficiency of the ratio to determine that the project is feasible with the current setup.
The current setup for the project involves a Celestron CPC 800 GPS (XLT) telescope and a fiber-fed Ocean Optics USB2000+ spectrometer.


Efficiency of the more basic system is calculated using a lab table procedure. An efficiency of the entire telescope system can be used in comparison to create an efficiency ratio of the system.

All of the telescope alignment takes place at long distances greater than the focal distance of the telescope, like the Willamette Basement Hallways. Here, the finderscope is being aligned to the eyepiece.

The fiber alignment process, which involves aligning the fiber to the eyepiece, is the most difficult part of the preparation. This is done in large areas as well, including the Willamette Basement Hallways, but dark rooms like Willamette 100 have given the best results.

Data is collected during the alignment process to track the max number of counts read by the spectrometer.

The furthest progress that has been made on the project is successfully getting a spectra of Vega using the SpectraSuite software. However, the integration time used to get the spectra was 60 seconds with a scans to average of 10, and box car smoothing of 10.

Winter 2014
During the winter term of 2014 the Astronomical Spectroscopy group, comprised of Gerald Buxton, William McNichols, and Justin Stockwell, made some good headway in determining how best to rebuild the fiber setup. To do so we focused on precisely determining the visual spot size of a calibrated beam coming out of the telescope. This was done through the use of a calibrated light source placed across the room and a beam profiler. Our results form this test are shown below.
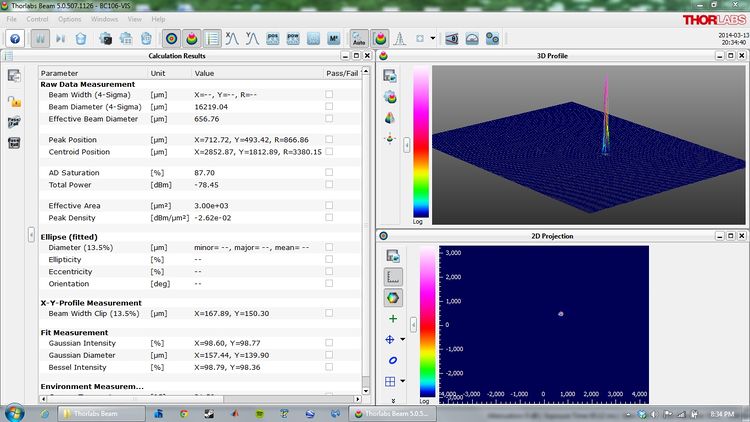

The key measurement needed to determine the feasibility of our setup is the Effective Beam Diameter. This measurement measures the number of pixels above a Clip Level of 1%. This effectively means that 99% of the light is focused into a spot with a precise diameter of 656nm. Our fiber size is 600nm so we are able to capture almost the entire amount of light from a calibrated light source.
We also were able to effectively determine the focal distance of our telescope. This will allow us to build a new fiber adapter to place the fiber mount at the focal distance of the telescope. With this information we no longer need a focusing mirror, instead we can use the telescope itself to focus the light into our fiber/spectrometer setup
Next term we plan on using the information gleaned from the beam profiler to rebuild our fiber adapter setup. This should allow us to couple at least 80% of the incoming light into our fiber, which is far better than the 1.1% we were coupling during the Fall term. We need to machine a new adapter that directly attaches the flip mirror to the telescope, as well adapter that couples the fiber with the flip mirror at an approximate distance of 11.88cm from the back of the telescope. With these adapters built, we should be able to take advantage of the nicer weather and get some better spectra of some astronomical objects.
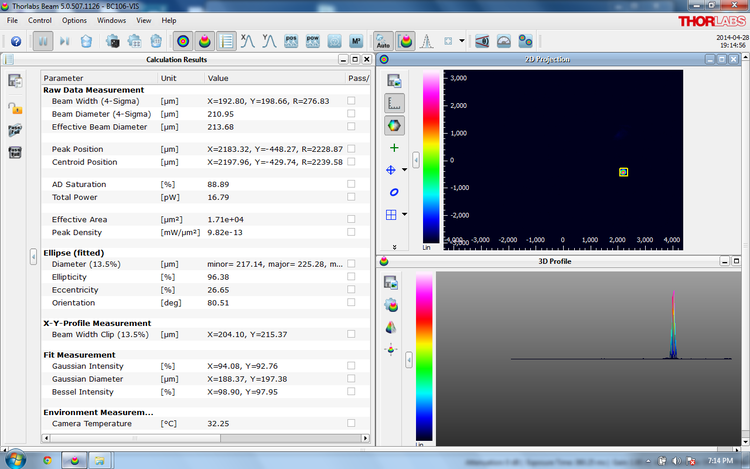
Spring 2014 This term we focused once again on using the beam profiler to determine minimum spot size coming through our telescope. But this time we wanted to see how the back focus knob affected the the focal distance of our telescope. We set up the profiler setup exactly as we had done it during Winter term with a calibrated L.E.D light source across the room, and the beam profiler set on the stands behind the telescope. This time, however, we placed the profiler on a sliding base that way we could see how the spot size changed as we adjusted the focus knob. Using this setup we discovered that our minimum spot size was 177um which is far better than the 656um we were able to achieve last term, and is well within the 600um core size of our fiber. Therefore with proper alignment we should be able to couple 100% of the incoming light through our telescope. We also discovered that were able to change the back focal distance substantially by turning the focus knob. Just 12 full turns increased the back focal distance to 48.5cm.

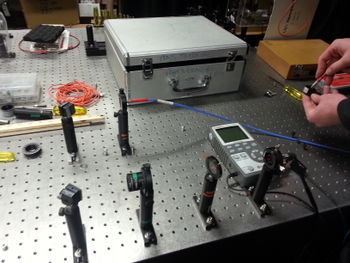
We also wanted to determine the overall efficiency our our spectrometer. That is, we wanted to determine a photons/count number at a particular wavelength. To do this we used a laser setup that consisted of a laser, a converging lens, two focusing aluminum plates, three neutral density filters and then our fiber fed spectrometer. This set up looks like this.

Through the use of a power meter we were able to a power meter we were able to accurately determine the laser thruput coming out of our fiber. Then by converting that power into number of photons/second we were able to compare that with the number of counts recorded by our spectrometer. The math for this is shown below.
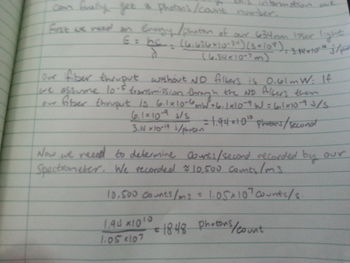

This showed that it was taking nearly 1850 photons at 634nm to record one count. This poor result may be an indication that the spectrometer we're using is not suitable for the high signal=to=noise, low signal that we get from observing stars.
The last thing we did was actually take the telescope out to observe. This allowed us to get a functional understanding of observation, and allowed us to figure out how to couple our telescope with the computer program Stellarium. This process is fully detailed in the new Observational Astronomy wiki under the advanced Projects tab. A couple of our results are shown below.


Presentations:
Links: