High-Power Pulsed Fiber Laser
HPPFL: Gerald Buxton and Jacob Megors
Background:
In fiber lasers, the active gain medium is an optical fiber that is doped with a rare earth element. In our laser, this element is erbium. However, other elements such as ytterbium, dysprosium, and thulium can be used. The development of fiber lasers has proved an influential component in terms of both advancement and application. For example, fiber as an optical path allows for a durable, transportable, and convenient physical apparatus. In addition, fiber properties allow for a high optical quality, while also making it easy to couple light. They allow us to achieve much greater power than otherwise, up to thousands of kW.
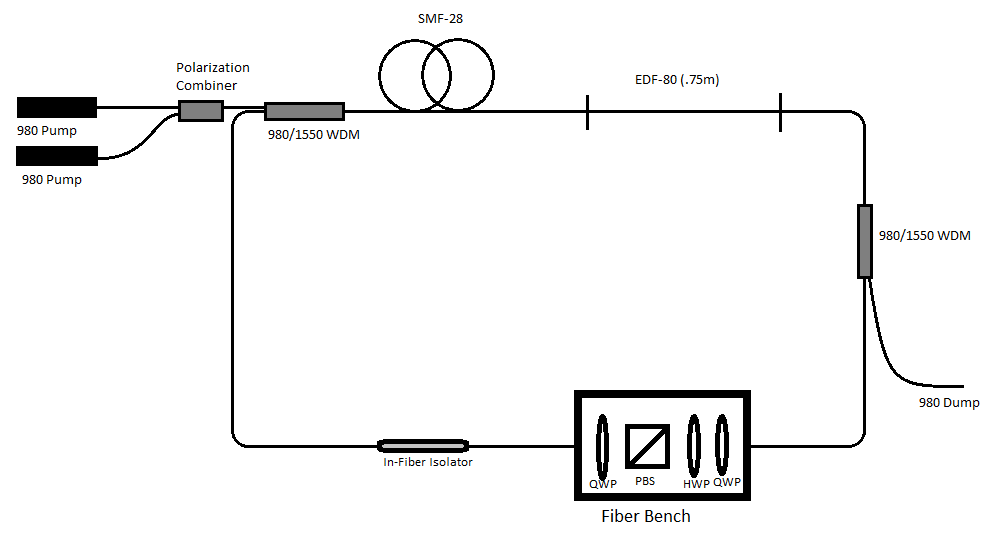
So how does a fiber laser work? Well, fiber amplifiers form the basis of all conceptual understanding. Basically, a typical fiber laser consists of a fiber amplifier placed within a cavity. The cavity, or ring, in our case, serves the purpose of providing the necessary optical feedback. The pumping process drives the activity of the laser, while there are several ways that this can work. For ours, and basically all erbium doped fiber lasers, the pumping scheme is considered to be “three level.”
In general, fiber lasers utilize stimulated emission in order to amplify light, in keeping with the famous LASER acronym (Light Amplification by Stimulated Emission of Radiation). In the process of pumping, the erbium dopant absorbs incident photons and is excited to a higher energy state. Quickly, the erbium is then relaxed to the first excited energy state. In this process, energy is stored and used to amplify the pump signal. For our three level model, the erbium occupies the ground state after each stimulated emission event.
While many fiber lasers utilize a Fabry-Perot cavity, while ours employs a ring cavity. One advantage of this is that most of the cavity is in fiber.
Our Set Up:
Optical Bench Alignment:
Early on, aligning the optical bench was a huge area of focus for our group. The bench was in bad shape, and we quickly realized realignment was necessary. Dar and David were able to achieve a fifty percent efficiency through the bench, and we kept this number in mind. In aligning the bench, it is necessary to first achieve something close to perfect collimation for fiber ports on both sides. Each fiber port has essentially 5 degrees of freedom. There are the x and y screws, which serve to tilt the lens in such a way that the direction of the beam can be variably moved up and down, and left to right. In addition, there are three “z” screws, which move the lens either closer or further from the fiber tip. In this way, you can pass the beam between divergence, collimation, and convergence.
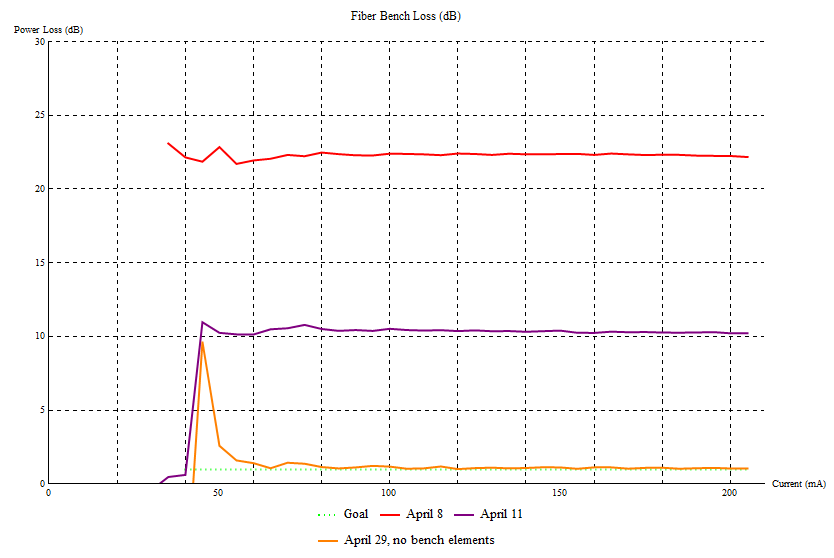
At first, we attempted to simply adjust these screws until we visually observed a collimated beam to the best of our ability. We used an IR card to determine the beam diameter along its path. While this improved the efficiency of the bench from when we found it, it was still very far away from where we needed to be. Theoretically, the bench should be able to achieve an efficiency of around eighty percent. Below, Plot 1 displays the loss levels for our first alignment attempt.
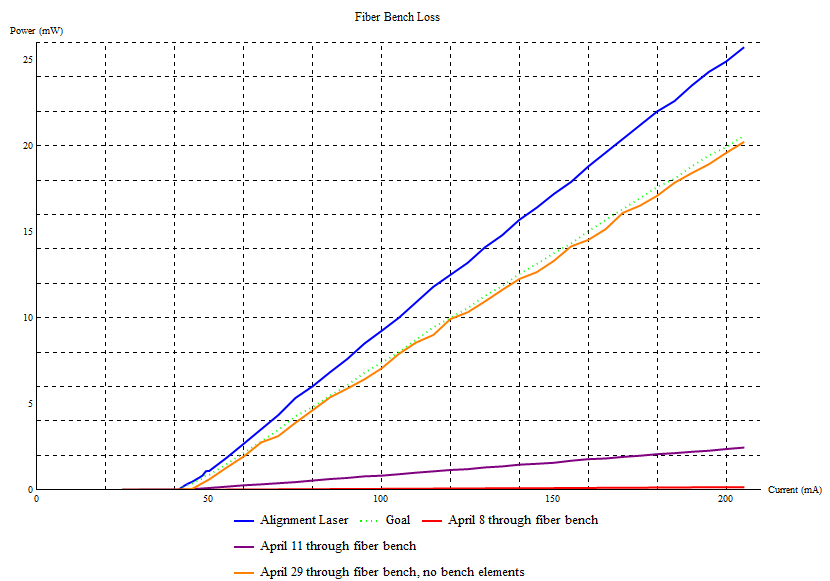
Soon, we stumbled upon a method that worked. We made a video of our process, so you can follow along if you would like. First, we had to make sure that we had the alignment laser pointed straight. We placed two alignment apertures on the optical bench, one as close as it could be to the fiber port in question, and one as far away as possible. Once the output through the second aperture was maximized, we were confident we had the laser pointing in the right direction. Next, we set up a beam profiler that was along this line of light. We hypothesized that collimation could be most closely achieved by minimizing the spot at some distant point. As such, the beam profiler was placed at the furthest point it could, still in line with the alignment laser. The beam profiler was a necessity, as it would be very difficult to characterize the size of a tiny spot such as the alignment laser. We observed a minimum by using the Thorlabs Beam Profiler software, then repeated the process with our second fiber port. Now, we were ready to place each fiber port back on the bench, and use a power meter to characterize our loss. Within the bench, we were able to carefully tweak the screws to fine align the bench. We achieved a maximum efficiency of 84%, a number we were thrilled with. Plot 2 displays the loss below.
Plot 1
Plot 2
Address of Goals and Progress
This term, our goals were thought out with summer 2014 in mind. As participants in the Internship program, Jacob and I were grateful for the opportunity to work on our HPPFL before the summer begins. Obviously, our summer will be busy and quick, so we prepared our goals with this in mind.
First, we wanted to measure and optimize the loss through the fiber bench in our set up. For more on this, please refer to the wiki page that specifically details our process, progress, and results. We were thrilled with our results in this area. Importantly, we were able to get hands-on experience with new materials and devices. For example, the Thorlabs IR Beam Profiler helped us confront this goal, while giving us a great excuse to learn new software and skills.
Secondly, we hoped to reproduce the self-pulsing behavior that Dar and David observed over the summer. With our new and improved bench (~80% efficiency, no elements), we were quickly able to reproduce these results. In addition, we developed a plan to overcome the presumed culprits of self-pulsing. Basically, it has been shown that lasers with erbium-doped fibers often display symptoms of self-pulsing operation. For more on the theory behind this, please refer to the (Insert graphs from an illustrator program that we discussed) appropriate section. To overcome this phenomenon, we hope that by adding a second 980 pump we will have enough power to overcome the problem.
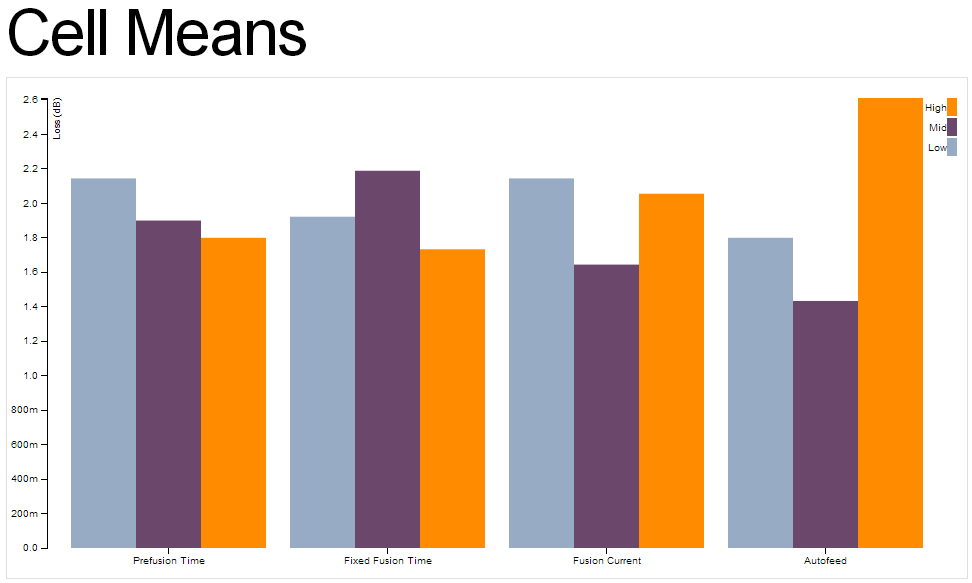
Next, we hoped to develop a method of fusion splicing EDF-80 to SMF-28 to replace the connectorized parts of the cavity. Previously, the laser had seen evidence of back reflections, hopefully due simply to faulty and imperfect connections. With this goal, we hoped to achieve a few things both practical and educational. Firstly, we hoped to better familiarize ourselves with the process of fusion splicing, one that is extremely relevant in industrial settings. In addition, we hoped to develop a consistent method for confronting the problem of EDF to SMF fusion splices. For whatever reason, the LID (Light-Injection Detection) system failed to function properly for this particular splice. As a result, we were unable to known with great certainty how efficient each splice was. We designed a simple factorial design experiment that would allow us to rather simply deduce the correct parameters for a good splice. There were many problems on the way. We hoped to test a series of values for specific parameters (variable on the RXS77), and then characterize the loss. To characterize the loss, we would essentially shine an alignment laser of known power through our spliced fiber, and measure the resultant loss through the connection. These results would be of great value for the lab, as this splice would no longer be an issue of great and unknown concern. We battled many obstacles along the way, but we eventually settled on both procedure and design. We have a new alignment laser that will not be absorbed through EDF. In addition, we were attempting to fusion splice fiber that had non-matching core sizes. We have ordered new fiber and corrected this problem. HWe are in great shape with respect to this goal, and we were able to perform a preliminary fractional factorial design experiment. While the results were not sufficient to deliver a conclusive answer, the experiment was worthwhile. We tested 4 parameters: Autofeed, prefusion time, fusion time, and fusion current. the results are documented below. The table provides the loss measurements for a given splice with the specified parameters.
The first file below shows the results of the ANOVA we ran. As you can see, the only parameter with a P-Value of less than 0.5 is autofeed. A p-value of 0.5 disproves the null hypothesis for the experiment. In our case, the null hypothesis is that these variables do not effect the quality of the fusion splice.
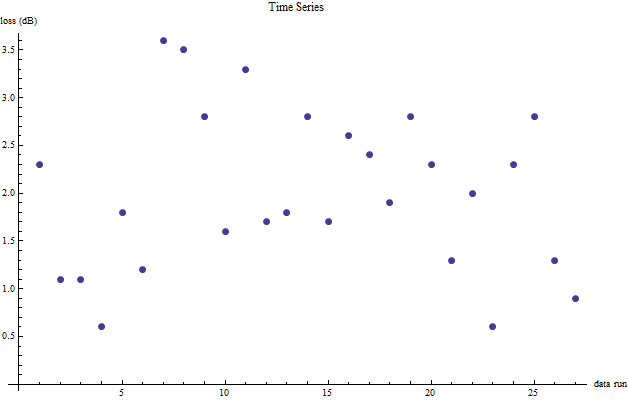
File 4 shows that we did not see a time series. This is a good thing, and it basically means that there was nothing systematically wrong with our procedure.
Finally, we hoped to be able to measure the dispersion of pumped EDF-80. In any final and functional laser, these measurements will be vital for deterring the correct length of EDF to be used. We will not get there this term, but we hope to be in a position to achieve these measurements this summer.
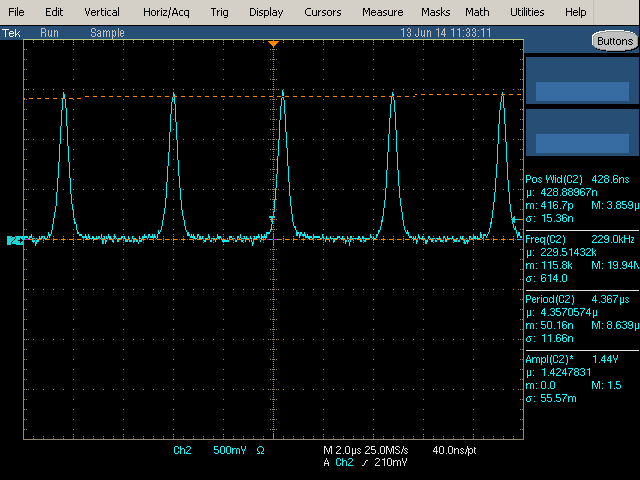
When we had the laser up and running, we were seeing self-pulsing.
To overcome this, we attempted to simply add a second pump to blast through the self-pulsing. We used a polarization combiner in order to do this.
