Function Generators and Oscilloscopes


Function generators and oscilloscopes will be covered as a pair. Oscilloscopes measures voltages as a function of time and displays the data on a graph. Function generators create a changing voltage under some function of time (often it is a sine wave, although there are a number of other shapes we'll see below). Thus, these two are natural to pair together. Note that sometimes oscilloscope is shortened to "oscope" or just "scope".
This module will also review some circuit elements (diode operation), fourier analysis of a signal and data fitting to a function.
For this topic, you'll need the following equipment:
- Rigol DG1022 Function Generator
- Rigol DS1102E Digital Oscilloscope
- 1kohm resistor
- 1uF resistor
- Protoboard
- A number of short wires
- Two BNC-to-banana socket adapters (left adapter shown to right)
- BNC-to-banana plug adapter (right adapter shown to right)
- Three BNC cables
- Two full sets of alligator clip - banana plug cables (that is a total of four cables with alligator clips on one end and banana plugs on the other)
This module is part of the General Lab Equipment Obstacle Course.
Contents
Circuit Setup

We will need some circuit to read voltages from. Setup a circuit to run the output voltage of the function generator through your resistor and read the voltage dropped across the resistor with the oscilloscope. How to carefully set this up follows.
To bottom output of the function generator, plug in the BNC and attach the free end to the BNC-to-banana-plug adapter. The plastic cap on the banana-socket should unscrew slightly and reveal a hole underneath. For each socket, push the exposed end of a wire through the hole, then tighten down the cap to secure the wire to the socket. The wires should not go to the same row of holes in the protoboard. Connect the wire to a row on the protoboard, and plug the adapter into the sockets. The rows into which you plugged the wires should now be connected to the output of the function generator. Plug opposite ends of the resistor into the two rows of the protoboard that you have powered. Current that flows from the function generator should now travel through the resistor.
On each side of the resistor, attach an alligator clip. Attach a BNC-to-aligator-socket adapter to channel 1 of the oscilloscope. Plug the ends of the alligator clip into the banana-sockets. This should allow the oscilloscope to display, on channel 1, the voltage across the resistor, as shown to the right.
Oscilloscope Setup
Turn on the oscilloscope with the button on the top of it.
- Controlling Displayed Inputs: Using the CH1, CH2, MATH, and REF buttons on the right side of the display, press each one until only the CH1 button is lit. This will allow the oscilloscope to ONLY display the input from the first channel.
- Changing Vertical Scale: Using the bottom knob in the "Vertical" column of controls, turn it until the yellow numbers in the bottom left corner of the screen read "200mV". This sets the oscilloscope such that the vertical scale has 200mV of measured voltage between each of the horizontal lines.
- What is the voltage at the top and bottom of the graph?
- Changing Horizontal (time) Scale: Turn the knob at the bottom of the "horizontal" column of controls. Turn it until the white "Time" setting at the bottom of the screen reads 50.00ms. This sets the bottom (time) axis so there are 50ms of data between vertical lines on the graph.
- What is the full amount of of time displayed on the display?
- Changing Trigger Source: It is likely that nothing is happening on the screen. Press the "MENU" button in the "Trigger" column of controls. A display should appear on the screen. Press the button next to the "Source" setting until it highlights "AC LINE'. You can also use the dial at the top of the controls to change which selection is made. Change the "Slope" setting to the arrow pointing upwards.
- The "Trigger" control tells the oscilloscope when to update data. The scope is constantly recording data, but only displays it when it is triggered. It is triggered when the source's voltage (currently the voltage in the AC line) crosses 0 volts in the direction set up by the slope (currently going from below 0V to above 0V. When it is triggered, the scope fills the left half of the screen with the data it has been recording, then fills the right half in real time.
- One being triggered, the oscilloscope will record data for the entire length of time the window is set for (with the horizontal time control knob - see step 3, above).
- You should be seeing the line on the display change. How long does it take for the line to change? How does this compare to the length of the x-axis (full time of the data).
- After it finishes recorded data, it will wait for another trigger. Once it sees the new trigger, it will overwrite the data it has displayed, so you should be seeing the line update roughly every 0.6s.
- Try changing the time-axis to 500ms. See how the scope updates? be sure to set things back to 50ms before continuing.
- Press the white circular "Menu On/Off" just to the right of the display. This should turn off any menus and show you the full screen of data.
A yellow line of 0 volts is boring, so let's give the oscilloscope a signal to measure.
Function Generator Setup
Turn on the function generator with the power button in the bottom left corner.
- Changing Output Controls: Press the "CH1|CH2" button under the display until the left box turns black, this gives you control over the output of channel 1.
- Changing Output waveforms: Press the "Sine" button under the function generator display to create a sine wave. The display should read "Sine" in the top left corner and the image of a sine wave should appear under it.
- Controlling Frequency: Press the left most blue button on the until the label above it reads "Freq". This allows you to set the frequency of the box. Using the two arrow buttons under the function generator dial and the dial itself to set the output frequency to 20Hz.
- Controlling Amplitude: Press the 2nd (from the left) blue button under the display so that the label above it reads "Ampl". This gives you control of the amplitude of the wave. The function generator has you input the wave's peak-to-peak voltage, that is the total voltage between the tops of the waves and the bottoms.
- If the sine wave is y=A Sin( 2 pi f t), how does the peak-to-peak voltage compare to the amplitude, A, of the wave?
- Turning on/off output: Press the bottom output button on the right side of the function generator to turn on channel 1 of the function generator. The label in the top-right corner of the left box on the display should change to "ON" from "OFF".
Oscilloscope Measurements
Now you should be seeing something on the function generator's screen. Hurray!
- If each horizontal line on the screen is 200mV, about what does the oscilloscope read for the amplitude of the wave. Is this correct?
- Count the number of full waves on the display. This is challenging yes? There are (at least) two ways to deal with this.
- Recording Single Scope Traces: Press the green-glowing RUN/STOP button in the top right corner of the oscilloscope. It should turn red and once the oscope completes its current run of recording data, it will stop recording data and keep the data saved on the screen. Pressing the RUN/STOP button again will return to recording data normally.
- The better way to look at the data is by changing the Triggering Source of the scope. Change the trigger source to Channel 1. Now the data only updates when it is triggered by channel 1.
- Because the scope is triggered when channel 1 crosses from negative to positive voltage, the exact center of the graph should be at 0V.
- Predict how the graph will change if you change the triggering slope to the down-arrow.
- Now change the slope to the down arrow. Was your prediction correct?
- Put the trigger slope back to the up-arrow.
- Changing Trigger Level: You can change the trigger so that it happens not when the voltage crosses zero, but when it crosses any arbitrary voltage level. To do this, turn the top knob in the "Trigger" control column. An orange line, with an arrow labeled "T" to the left of the graph, should appear and follow how you turn the knob. This sets the voltage at which the scope is triggered. When the voltage crosses this threshold (in the direction chosen with "slope") the oscope will begin collecting data.
- As you change the triggering voltage, how does the voltage at the left side of the screen change? Does this make sense?
- Predict what will happen if you move the trigger voltage above (or below) the amplitude of the wave. Try it. Return the trigger voltage to 0V.
- Change the scale of the vertical axis to 100mV. Did the graph do as you'd expect?
Create another identical circuit to the one above. Use channel 2 of the function generator to put an identical sine wave through the resistor (20Hz and 1V amplitude). Measure the voltage drop in the resistor using channel 2 of the oscilloscope and turn on the channel 2 display for the scope.
- Controlling Multiple Scope Input Channels: Pressing the CH1 button on the scope will give you control over channel 1. Set its vertical scale to 500mV. Pressing the CH2 button will then give you control over channel 2's properties. Set its vertical scale to 500mV. The two graphs should line up on top of each other.
- Change the horizontal scale of Channel 1 to 50ms.
- Change the horizontal scale of Channel 2 to 100ms.
- What happened to the scale of Channel 1?
- Set both horizontal scales to 100ms.
- Controlling 0V point of graph: Turning the top knob on the vertical column of controls will adjust the offset of the scope. Change the offset of channel 1 to +0.5V and the offset of channel 2 to -0.5V.
- Set the scope to trigger on Channel 2 when it crosses 0V.
You should now see two identical traces on the scope, with their traces offset from each other by 1V.
More Function Generator Controls
- Setting Output Waveforms: Make sure you are controlling the output of Channel 1 of the function generator. Press some of the other waveform buttons (Square, ramp, pulse) under the display and observe the changes on the oscilloscope.
- Return the wave form to be a sine wave. We want to overlap the two signals on the oscilloscope by adjusting the voltage output from channel 1 of the function generator, that is we want the voltage to be V=V0+A sin(2 pi f t). By how much should you adjust the voltage by to make this happen?
- Changing Wave Offset: Press the button under the "Offset" label on the display. Use the knob and arrows on the function generator to change the voltage and make the two graphs overlap.
- It is likely that your graphs will not overlap perfectly. They'll have some phase difference between them. The phase of each output is set randomly when that channel of the function generator is turned on. See that by turning on and off the output of channel 1 a few times. Note that the wave forms shift relative to eachother.
- Aligning output phase: Press the blue button under the "AligPha" label on the display. This should fix both phases so that they are the same. Did it?
- Turn off and then back on channel 1 to get a random phase.
- Changing output phase: Press the blue button under "Phase" on the function generator display. Use the knob and arrow buttons to adjust the phase of channel 1 so that the outputs of channel 1 and 2 look the same.
- Move the phase back to 0 degrees.
Oscilloscope Channel Comparisons
While performing experiments, just eyeballing the phase of two wave's isn't enough, there should be a better way to check it.
- Signal Difference: Press the "MATH" button on the oscilloscope. A purple graph should appear. Use the blue menu buttons and dial to set the "Operate" menu to "A-B", Source A to CH1 and Source B to CH2. Thus, the purple menu should be the difference between the two channels. Adjust the vertical scale of the function generator to 20mV.
- Change the phase of channel 1 with the function generator to make the difference signal as small as you can make it, changing the scale and offset of the function math channel graph as needed. How close is this to your value from earlier? Set the phase of channel 1 back to zero.
- Measuring Phase: Press the "Measure" button in the top left corner of the oscope. This should bring up the measurement menu. Press the "Time" button and use top knob to select "Phase 1->2 (down)". Press in the top knob to selection this. A green value should appear on the screen and show you the phase between the two channels. Does this agree with what you've found?
- You should note that the phase reading moves around some. That phase measurement is so-so and should really be measured using another device.
- Set the phase for channel 1 to 0 and align the phases of the two channels.
- Signal Sum: Return to the math menu and change the Operate control to "A+B". The purple graph should now show the sum of the two waves.
- Change the frequency of channel 1 to produce a 2Hz beat note in the purple sum signal. How would the signal change if you were look at the difference of these two new waves. Try it.
- Change both channels of the function generator to output 35Hz signals.
- Fourier Transform: Recall that the fourier transform of a time signal gives information about the frequencies that appear in a signal. In the math menu, change the Operate option to "FFT", the Source to CH1, the Display to "Full Screen" and scale to "Vrms". This should display the fourier transform of whatever signal is in channel 1. Note that you can press the CH1 and CH2 buttons twice to turn off the displays for channel 1 and 2 without affecting the math signal.
- FFT Frequency Spacing: With the FFT information at the bottom of the screen, does a peak appear at the frequency you expect? You can use the horizontal scale knob to change the frequency spacing of the fourier transform without affecting the time scaling of the input channels. Change the scale to 5Hz/div to see if the FFT is showing you the correct frequency.
- Horizontal Cursor: There is another way to read values from the display. Press the "Cursor" button so that it lights up. One or two lines should appear on the screen. Use the blue menu buttons to change the Mode to "Manual", the Type to "X", the Source to "FFT" and to highlight only the curl under CurA (i.e. cursor A). Now using the knob at the top of the oscilloscope, move the white line horizontally. You'll note that the box that has appeared on your screen will change values - showing you the frequency at which the cursor is currently set. Overlap cursor A with the peak in your graph. Does it give you correct frequency?
- Hopefully you know that any periodic function of frequency f can be made by summing sine waves with multiples of that frequency with different amplitudes. That is a periodic function, V(t) can be written as
Change the frequency scale to 25Hz/div. Set Channel 1 on the function generator to create a square wave. How does the frequency spectrum on the oscilloscope change? Use cursor 2 to show you the frequency that another other peaks show up at. You may wish to turn the vertical scale knobs to make the spectrum appear bigger and to move the bottom of the spectrum closer to the bottom of the display.- How does the frequency of the 2nd large peak compare to the frequency of the first? Which harmonic of the main frequency is this?
- Do any other large peaks show up? What are their frequencies? What harmonics are those?
- Do you think a square wave contains all harmonics, only even harmonics or only odd harmonics?
- Turn on the channel 1 display and change the time basis to 20ms. Note that this changes the frequency spacing of the FFT greatly. Adjust the frequency basis back to 25Hz/div. You'll also note that the FFT graph looks "smoother". This is because the finest spacing in frequency that the FFT function can display is related to the full-time of the time signal - a shorter time means less fine spacing in frequency.
- Now what harmonics show up in the graph?
- Change the output of channel 1 to a "ramp". What does the channel 1 signal look like - is it a triangle wave or a saw-tooth wave? Which frequency components show in in this waveform?
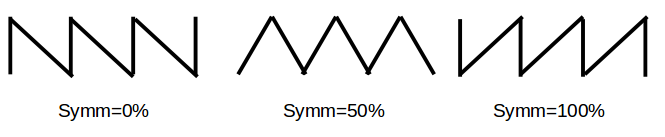
- Setting Triangle/Saw-tooth Waves On the function generator, press the blue button under the "Symm" label on the display. Symm sets how symmetric the ramp is. If "Sym" is set to 50%, the function should be a triangle wave - 50% of the "front" half of the signal is the ramp. If "Symm" is 0%, 0% of the "front" half of the signal will be the ramp - that is the ramp will jump from its lowest value to its highest value, then slowly ramp back down to the lowest vale. If Symm is at 100%, the instantaneous jump will occur at the end of the wave. Both the 100% and the 0% Sym settings are saw-tooth waves. These three settings are shown below.
- Look both the triangle waves and the saw-tooth waves. How do their frequency components, the harmonic content of the wave, compare?
- Vertical Cursor: Press the cursor button and change the "Type" to Y. Now two horizontal lines should appear on the screen. Using the knob at the top of the oscilloscope, you can change the height of each cursor. The values that are listed in the box show you the voltage that the cursor is at.
- Set channel 1 to be a saw-tooth wave (Symm=0% or Symm=100%)
- Use the cursors to read out the heights of the first few harmonics of the saw-tooth wave. (try setting the vertical scale for the FFT plot to 50mVrms/div and the horizontal scale to 25Hz/div).
- How do these heights compare? How do you think the coefficients, , scale as a function of the harmonic, k, for the saw-tooth wave, based on your data?
- Try plotting your data (measured vs on a computer. Plot the data on a log-log plot and fit a line to this plot. The slope of that line, m, should be how the coefficients scale with k, i.e. ).
- Change the waveform in channel 1 to be a triangle wave (Symm=50%). Measure the peak heights for the triangle wave. You may have to change the vertical or horizontal scaling to get better readings of the heights. How do the coefficients scale for the triangle wave?
- Repeat for the sqaure wave.
- Loop up the triangle, square, and sawtooth wave online or in a text book. Did you get the correct forms for the coefficients?


Frequency Sweep
X-Y Plotting and External Trigger

Disconnect the two resistors from the function generator. With channel 1, output a sine wave with frequency of 35Hz and amplitude of 1.5V. Connect the output of channel 1 to the diode and one resistor in series. Use the channel 1 of the oscilloscope to measure the voltage across the diode-resistor pair and channel 2 to measure the voltage across just the resistor. These should be set up like the diagram to the right.
Set the frequency and amplitude of channel 2 of the function generator to match that of channel 1. Make channel 2 be a square wave and sync the phases of the two outputs.
- External triggering: Connect the output of channel 2 of the function generator to the External Trigger input of the oscilloscope. In the oscilloscope's trigger menu, set the source to External, Edge triggered, and a down arrow for the direction.
- The external triggering allows you to trigger the scope's data recording without interfering with displaying two different voltage signals. This is useful, for example, when measuring the voltage across a resistor and a capacitor in an RC circuit as there will be a phase different between the voltages.
- The edge triggering is best for square pulses as it just relies on the signal going from high-to-low (or low-to-high). Using the slope setting for square waves cause issues as the slope when a square wave changes is infinite. For non-square waves, this will behave identically to the slope triggering, but not vice-versa.
- Set the vertical scale of both oscilloscope channels to 500mV and the horizontal scale to 5ms. How do the two graphs of the voltage out of the function generator (channel 1) and the voltage dropped across the resistor compare (channel 2) compare?
- Change the vertical offset of channel 2 on the oscilloscope to force the graphs to overlap as much as you can. What must be true about the voltage across the diode so that current flows through it? About what voltage is needed?
- Cursors: Track Mode: Open the cursor menu and set the mode to "Track". When using this mode, the cursor(s) will follow the voltage in a channel and show you time and voltage information at the same time.
- Set the "Cursor A" control to CH2 and move the cursor to the "corner" where the voltage turns on or off. You can eye-ball it, or move watch the "A->Y" chart value goes above 0V.
- Set the "Cursor B" control to CH1 and move this cursor so that the "|ΔX|" value in the chart is 0s. Here, the time-separation between the two cursors is zero.
- What is the voltage read at cursor B (the "B-> X" value in the chart)? This is the minimum voltage needed for current to flow through the resistor.
- Changing Time Basis: Press the "Menu" button in the middle of the horizontal control column. Use the menu buttons to change the "Time Base" from Y-T to X-Y. This shows the voltage in channel 1 plotted along the x-axis and the voltage in channel 2 plotted along the y-axis.
Function Generator Topics:
- Frequency, amplitude, offset, phase
- Frequency sweep/ramp
- Sine, square (incl. TTL), triangle, sawtooth, arbitrary waveforms (possibly a demonstration of Fourier components)
O-scope Topics:
- Voltage/time scale
- Coupling
- Triggering
- Scope probes
- Termination
- Bandwidth, sampling
- Aliasing
- Analyzing data: cursors, averaging, math menu
- Exporting data
- Analog and digital scopes