Difference between revisions of "Spontaneous Parametric Downconversion"
(→Experimental Setup) |
(→Experimental Setup) |
||
| Line 36: | Line 36: | ||
In our experiment we started with a 405nm blue diode pump laser. We then put the laser through an iris and a linear polarizer to ensure horizontal polarization. Once through the polarizer the laser was then pushed through a half wave plate in order to change the polarization of the beam from horizontal to vertical polarization. After being reflected off of two mirrors the light is incident on the downconversion crystal, producing two 810nm output beams. A beam blocker was placed down the beam path to block any stray 405nm light. The two output beams (signal and idler beam) traveled at an angle of roughly 3 degrees off axis with respect to the input beam. These two beams would then travel down their respective legs and reach a photodetector to record their individual and coincidence counts. See the block diagram as well as the setup photograph. | In our experiment we started with a 405nm blue diode pump laser. We then put the laser through an iris and a linear polarizer to ensure horizontal polarization. Once through the polarizer the laser was then pushed through a half wave plate in order to change the polarization of the beam from horizontal to vertical polarization. After being reflected off of two mirrors the light is incident on the downconversion crystal, producing two 810nm output beams. A beam blocker was placed down the beam path to block any stray 405nm light. The two output beams (signal and idler beam) traveled at an angle of roughly 3 degrees off axis with respect to the input beam. These two beams would then travel down their respective legs and reach a photodetector to record their individual and coincidence counts. See the block diagram as well as the setup photograph. | ||
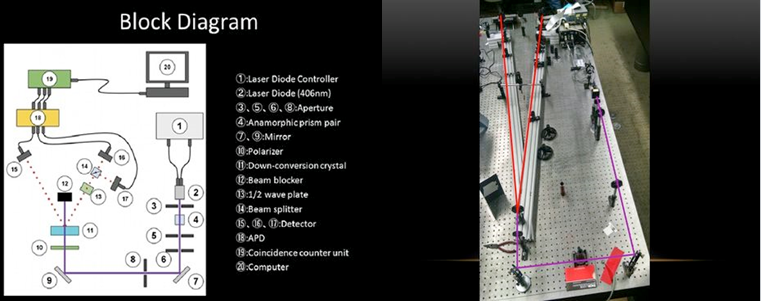
| − | [[File:Diagram.png|x350px|thumb|center|Left: block diagram of SPDC experiment.(Some optics not included in all experiments) Right: Optics table overview. Purple beam = 405nm input, Red beams = 810 DC outputs.]] | + | [[File:Diagram.png|x350px|thumb|center|'''Left:''' block diagram of SPDC experiment.(Some optics not included in all experiments) '''Right:''' Optics table overview. Purple beam = 405nm input, Red beams = 810 DC outputs.]] |
= Results = | = Results = | ||
Revision as of 20:26, 22 March 2015
Contents
Quantum Optics and Spontaneous Parametric Downconversion
The goal of this project is to use a series of table-top laser-based optics experiments to investigate various quantum mechanical phenomena. These include, but are not limited to: quantization of the electric field (proof of the existence of photons), single-photon interference, violation of Bell inequalities, and quantum information measurements.
Physics Background
Overview
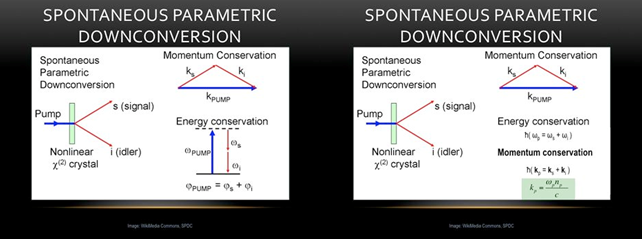
Spontaneous parametric downconversion (SPDC) is a non-linear optical process that takes place with the assistance of specially-engineered optical crystals. These optical crystals are designed with specific index of refraction properties along given crystalline axis. When light of a specific frequency is incident upon the lattice, it will experience preferential absorption and re-emission as a result of this design. This will result in an overall "splitting" of one incident light beam into two beams, a "signal" and an "idler" beam, at some well-defined angle with respect to the optical input axis (serving as the zero). The quanta of light will experience a downconversion but within this the momentum and energy of the beam is conserved in the signal and idler beams. See figure 1 for an illustration, below for a simplified explanation, and the WikiPedia article for maximum detail.[1].
Downconversion
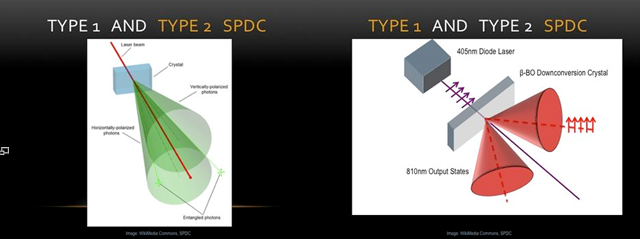
If we reduce the incident beam to a series of single photons, whose existence is a central postulate of quantum theory, the above description need only be slightly altered. A single photon incident on the crystalline lattice has a certain probability of being downconverted via the interaction with the lattice (roughly 1 in 10^12)[2]. When this conversion takes place, the single photon, with its inherent polarization properties, is converted into a pair of polarization entangled photons at half the energy and wavelength. The output pair has the same polarization, but is polarized orthogonal to the input beam. Type II follows the same characteristic downconversion (DC) as the Type I but with one very crucial difference. In Type II downconversion the polarizations of the output beams are now orthogonal to one another (with some overlap in their respective electric fields so that there is a possibility for photon interaction, and unlike that of Type I where there is no possibility for interaction after the downconversion crystal). The way one sets their experiment for Type I or Type II downconversion is by choosing the correct the crystal lattice cut (i.e. purchasing the correct crystal). The lattice will be cut in such a way that the axis with varying indices of refraction will favor one DC type over the other.
Single Photon Fields and g2
NOTE: This section heavily references from Mark Beck's text Quantum Mechanics: Theory and Experiment which is mentioned in the references and available in the lab.
In any optics experiment the experimenters usually convert light to electric current via some photodetector and diode scheme. If one wishes to measure single photons, the question must then arise - how could you distinguish the "granularity" of a single photon incident on your detector from that of the single electrons flowing in your electrical detection scheme? Fortunately there exists a way to quantize the electric field incident on the detector that circumvents this issue entirely. The quantization of the electric field will not be presented in detail here, nor will the derivation of the g2 values. These details can be found in section 16 of Beck.
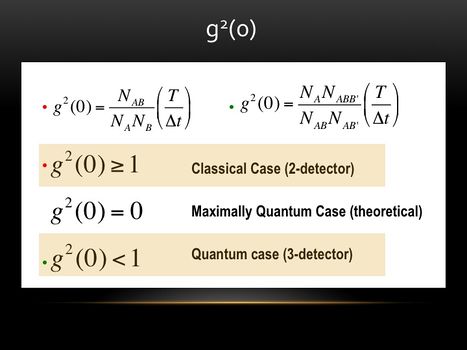
For ease of presentation, it should suffice to say that the g2 factor (degree of second-order coherence) is a numerical value describing the ratio of intensities between two electric fields. This ratio can be cleverly mainpulated, after the coherent electric field from a laser source has been properly quantized, to yield detection probabilities in different regions of space. These probabilities can then be averaged over time to yield estimates for the number of photons one would expect to be incident upon a detector placed in the region of the field. Below are the most basic depictions of these values. For more detail, see the WikiPedia page [3] .
Measurement of photon counts over time at an array of photodetectors can be analyzed for their degree of correlation. Positive, zero, and anti-correlations at the detectors all play a very important role in claiming the nature of the electric field present in the chosen experiment. The constraints on g2 being 0 < g2 ≤ 1 for a quantum mechanical field and g2 ≥ 1 for a classical electric field are determined by analyzing the ratios for the 2-detector and 3-detector schemes for our chosen experiments. To understand this in the context of the experiment, please see the results section.
Experimental Setup
In our experiment we started with a 405nm blue diode pump laser. We then put the laser through an iris and a linear polarizer to ensure horizontal polarization. Once through the polarizer the laser was then pushed through a half wave plate in order to change the polarization of the beam from horizontal to vertical polarization. After being reflected off of two mirrors the light is incident on the downconversion crystal, producing two 810nm output beams. A beam blocker was placed down the beam path to block any stray 405nm light. The two output beams (signal and idler beam) traveled at an angle of roughly 3 degrees off axis with respect to the input beam. These two beams would then travel down their respective legs and reach a photodetector to record their individual and coincidence counts. See the block diagram as well as the setup photograph.
Results
Group 3: Kevin Masson and Alex Schachtner
Maximizing Photon Counts
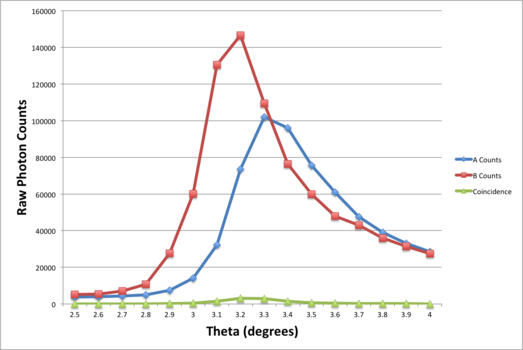
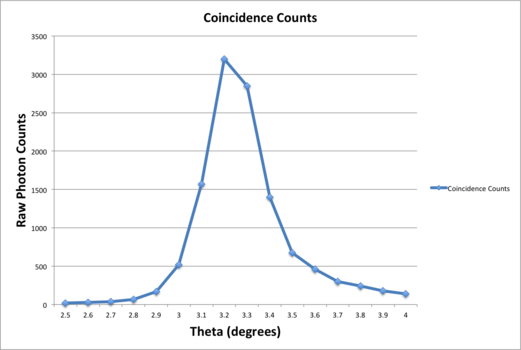
In order to have the best possible experimental results, we sought to maximize the photon counts on each optical leg of the experiment. To do this, we varied the angle of each optical leg from 2.5 degrees to 4 degrees by increments of one-tenth of a degree from the central axis. Recorded values of photon counts are shown below. We found that the maximum counts occurred at approximately 3.2 degrees. This matches the theoretical maximum angle for photon counts of 3 degrees.
Proving the Existence of Individual Photons
Measurement of individual photons is done in this experiment via determining the g2 value referenced in the background section. Two measurements were devised for comparison of their resultant values - a two-detector measurement for illustrating the classical electric field value of g2, and a three-detector measurement for verifying the quantized electromagnetic field.
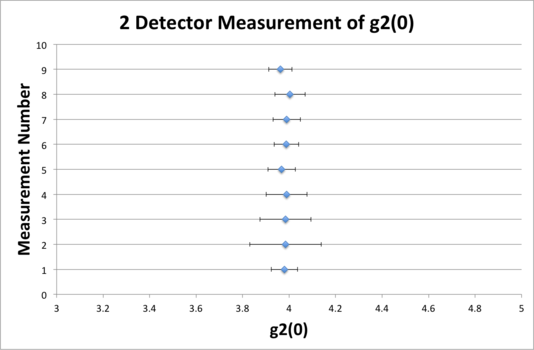
For a two-detector scheme, coincidence counts are seen as a result of positively-correlated or non-correlated measurements of a single input electric field being split by the polarizing beam-splitting cube (PBSC). If one pictures the electric field incidence on a refractive crystal, they expect the outputs at subsequent faces to be phase-shifted copies of the input field. This is purely a classical electrodynamic effect - polarized EM plane waves incident on the PBSC become phase-shifted polarized plane waves when re-emitted. g2 measurements at the B and B' detector show these results by expecting g2 ≥ 1 in the mathematical scheme outlined above. Our results indeed show g2 approximately 3.9 for this measurement:
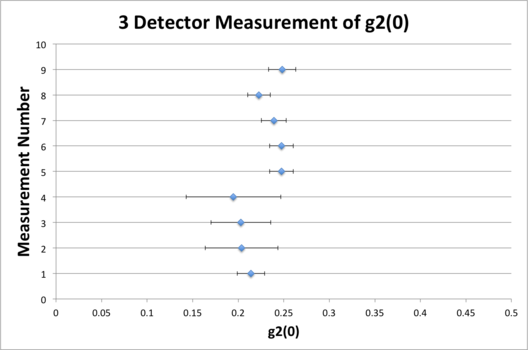
For a three-detector scheme, coincidence counts are a result of anti-correlated measurements on a single-photon field across detectors A, B, and B'. Single photons incident on the PBSC have a 50% probability of reflection or transmission at the PBSC refraction face. When analyzing the AB and AB' coincidence counts, one would expect at least one of these values to be exactly zero when considering a single photon source - the photon will only be incident on either the B or B' detector, not both. This yields a measurable value of 0 < g2 ≤ 1 by virtue of the ratios outlined above. Out results show an average value of g2 approximately 0.235:
For the next part of our experiment we added the third detector (B') and the polarizing beam splitting cube as described above. In this part we did a coincidence count between sensor A from the signal beam and sensor B from the idler beam from here we then were able record the g2 number for the two detector case. In this case we got a number greater than one which then solidifies the fact of light having a classical characteristic about it. We then proceeded to take a 3-detector coincidence count in order to look at the g2 number. From here we then took recordings from the B' sensor on the idler beam. This then allowed us to get an ABB' coincidence count. Here we got a value much less than one, which in our case as described above gives us that light has quantum characteristics to it. This then tells us that light is composed of particles and these particles are called photons. This experiment gives us a certainty to the existence of photons but not only that, it expressly shows that of which Thomas Young found in his famous nineteenth century experiment commonly called Young's experiment, which is that light has characteristics of both waves and particles.
External Resources
Mark Beck's Page, Whitman College
References
1.) Beck, M. Quantum Mechanics: Theory and Experiment. 2011. Wiley & Sons. [4]
2.) S. P. Walborn, M. O. Terra Cunha, S. Padua, A Double-Slit Quantum Eraser Physical Review A, (65, 033818, 2002).
