Difference between revisions of "Photo-Electric Effect"
(→Photo-Electric Effect Module) |
|||
| Line 33: | Line 33: | ||
Winter 2015 Results: | Winter 2015 Results: | ||
| − | Using the same apparatus without modifications I recorded data for 405, 468, 505, 525, 569, and 573 nm LEDs. The plot of the stopping voltage vs. frequency is shown below. | + | Using the same apparatus without modifications, I recorded data for 405, 468, 505, 525, 569, and 573 nm LEDs. The plot of the stopping voltage vs. frequency is shown below. |
[[File:Picture1.png]] | [[File:Picture1.png]] | ||
| + | |||
| + | Taking a fitted slope of the plot, I find the gravitational constant G = (1.83 +/- 0.2)*10^-15 eV*s. This is within the same magnitude of the accepted value of G = 4.136*10^-15 eV*s. This is a good measurement considering the different errors discussed above. An LED emits a gaussian spectrum of frequency where the peek coincides with the wavelength describing the LED. In an attempt to reduce this error I repeated the experiment with 405, 532, and 636 nm lasers. I had trouble reproducing currents because each location the laser was shined on the cathode gave different values. I tried to fix a beam on the cathode using a stand. The 636 nm laser did not produce any results so it must be under the limiting frequency. That left me with two lasers for the plot below. | ||
| + | |||
| + | [[File:Picture2.png]] | ||
| + | |||
| + | As you can see, the measurement gave me G = 2.49*10^-15 eV*s which is within 40% of the accepted value, but the error is infinite due to only using two data points. In the future we could order more lasers above the limiting frequency, but clearly the apparatus is not meant for a narrow laser beam. I would use laser diodes with beams that broaden out in a cone shape. These should fill the area on the cathode and produce more monochromatic light. | ||
Revision as of 11:14, 22 March 2015
Photo-Electric Effect Module
Photo-Electric Effect Web Page
The Photoelectric Effect was first observed in the mid-nineteenth century. It occurs when light is shone onto a metal object, electrons are excited to the point of being emitted from the metal’s surface. Prior to the twentieth century light was believed to behave purely as a wave, which was confirmed by Young’s double-slit experiment (Wikipedia). In Classical Theory, the more intense the light is, than the light should emit electrons of higher energy, but this is not observed, and therefore poses a problem for the Wave Theory of Light. Albert Einstein suggested that light was made of particles of a discrete energy, contradicting the Wave Theory. Einstein’s theory suggested that a light particle (photon) would strike an electron of a metal object, which would then absorb the light particle. If the photon had enough energy, the electron would be emitted from the metal object. Einstein’s theory explains the Photoelectric Effect, and also differs from Wave Theory because he states that light is made of particles that deliver discrete energy, and the intensity of the light does not change the energy of the electrons that are emitted. The Einstein explanation of the Photoelectric Effect provided another example in favor of Quantum Theory, which states that energy comes in packets, and everything has a discrete amount.
Using the Photoelectric Effect, an experiment was designed to find Plank’s constant, h. This constant is one of the natural constants, to which all physical expressions can be related to in one way or another. Plank’s constant is used consistently in quantum mechanics and finding a value for h would give numerical values to many different equations.
To achieve this, an apparatus was constructed to find the stopping voltage across a phototube of which has light shone on it to create a current. A phototube is a glass tube which has two different terminals in it. The plate that has the electrons emitting from it is called the cathode, which has a larger surface area than the anode which is a pin that the electrons strike to create a current. The cathode is the plate that has the light shining on it and actually produces the effect that is being used. The stopping voltage is a potential that resists the electrons flying towards the anode. By increasing this stopping voltage to a certain point, the current will become zero across the phototube. This value is the stopping voltage for that particular frequency of light.
Using an equation that Einstein put forth to help explain the photoelectric effect, the stopping voltage can be related to the frequency of the incoming light. This equation is Ephoton = KEelectron + W where Ephoton is the energy of a photon of a certain frequency, KEelectron is the maximum kinetic energy of the incoming electrons, and W is the amount of energy it takes to emit the electrons from the metal’s surface. To relate the stopping voltage to the frequency, the above equation’s components must be substituted: Ephoton is equal to hf where h in Plank’s constant and f is the frequency of the incoming light and KEelectron is qV where q in the charge in question and V is the stopping voltage. Putting everything together and solving for V, the equation is V=hf-W. The charge is left out because each side has been divided by the value and now everything is in units of eV (electron volts). The stopping voltage and frequency can now be related by the above equation. If the stopping voltage is plotted with respect to the frequency, a linear regression will result in the slope of the graph and the y-intercept. The y-intercept will be equal to the work function of the metal and the slope of the data will be the measured value of h.
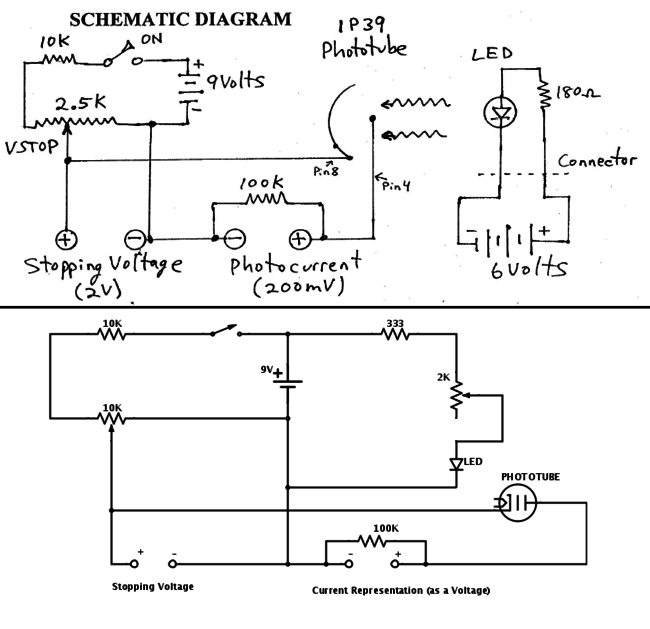
The other goal was to build the apparatus that would eventually be used to measure Plank’s constant. The apparatus was based on a schematic that was found online which gave instructions on how to build a photoelectric apparatus. Some changes were from the original schematics. These include a single power supply that could be plugged into a socket, a wider range of stopping potential, and the ability to change the intensity of the LED’s light that was emitted. These were all put together into a simple circuit and built up to create a working apparatus. 
The light that was used in the experiment was from four different LEDs varying in wavelength from an orange-yellow to a low ultraviolet. The stopping voltage for each LED was recorded seven times in the absence of ambient light. The values of the peak frequencies and a rough estimate of their standard deviation for each LED was found from their respective data sheets and converted to their respective frequency. The data was then plotted and a linear regression was fit to the data
After some error propagation the slope of the data, the calculated value of Plank’s constant, was found to be (2.56 +/- .05)*10^-15 eV*s. This value is within 40% of the accepted value of 4.136*10^-15 eV*s which is pretty close for an apparatus that was built from the ground up and under $200.
Looking at the data, the stopping voltage was measured can be trusted to be accurate. The only other thing that could have caused this inaccuracy would be the frequency of the incoming light. These values were given on the data sheets of each LED and were believed to the peak wavelength/frequency. The problem with this is that the stopping voltage was is measured is preventing the most energetic electrons from completing he circuit. And the electrons that have this energy most likely absorbed a photon of a higher frequency than the given peak value. LEDs don’t actually produce a single wavelength/frequency of light, but a range of them; only lasers produce monochromatic light. This could explain the difference between my value and the accepted value.
By playing around with my data, it was found that if the frequency is decreased or the stopping voltage is increased by 2/3, then the resulting linear fit gives a value extremely close to the accepted value. This is extremely counter intuitive, but actually makes sense. By decreasing the frequency and keeping the stopping voltage the same, it means that each photon now has more energy per unit of frequency. And by increasing the stopping voltage, but keeping the frequency the same makes each photo have more energy that before.
This manipulation of data actually proves the previous theory to be incorrect. If it is continued to be believed that the stopping voltage values to be valid, then the actual frequency of the photons must be less in order for the measured Plank’s constant to increase toward the accepted value.
There are a few things that my help the accuracy of this experiment. The first and easiest way would be to find what type of metal the cathode is made of and compare the work function that was found to that of the actual metal. If the two values are different, then setting the y-intercept to the accepted value may change the slope of the linear regression. The other thing that could be changed would be to use monochromatic light on the phototube. This light should be passed through a lens of some kind to decrease the intensity in order to protect the phototube. An error in grounding the circuit of the apparatus did come to mind, causing an artificial high stopping voltage, but when the phototube is in a dark environment the current is always zero. This shows that the circuit works perfectly and the problem is from another source.
Over all, the experiment was quite successful and even with the inaccuracy produced a solid result. The above my prove fruitful in further research or may not. It is merely a suggestion as to a jumping off point in search for a value comparable to the accepted value of Plank’s constant.
Original plans for Photoelectric Effect Apparatus Media:LEDphotoelectric_apparatus.pdf
Winter 2015 Results:
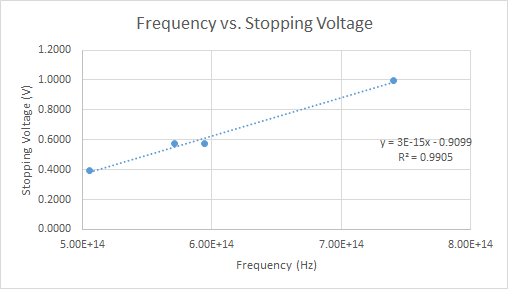
Using the same apparatus without modifications, I recorded data for 405, 468, 505, 525, 569, and 573 nm LEDs. The plot of the stopping voltage vs. frequency is shown below.
Taking a fitted slope of the plot, I find the gravitational constant G = (1.83 +/- 0.2)*10^-15 eV*s. This is within the same magnitude of the accepted value of G = 4.136*10^-15 eV*s. This is a good measurement considering the different errors discussed above. An LED emits a gaussian spectrum of frequency where the peek coincides with the wavelength describing the LED. In an attempt to reduce this error I repeated the experiment with 405, 532, and 636 nm lasers. I had trouble reproducing currents because each location the laser was shined on the cathode gave different values. I tried to fix a beam on the cathode using a stand. The 636 nm laser did not produce any results so it must be under the limiting frequency. That left me with two lasers for the plot below.
As you can see, the measurement gave me G = 2.49*10^-15 eV*s which is within 40% of the accepted value, but the error is infinite due to only using two data points. In the future we could order more lasers above the limiting frequency, but clearly the apparatus is not meant for a narrow laser beam. I would use laser diodes with beams that broaden out in a cone shape. These should fill the area on the cathode and produce more monochromatic light.


