Difference between revisions of "Spontaneous Parametric Downconversion"
(→Experimental Setup) |
Aplstudent (talk | contribs) |
||
| (21 intermediate revisions by 2 users not shown) | |||
| Line 8: | Line 8: | ||
== Overview == | == Overview == | ||
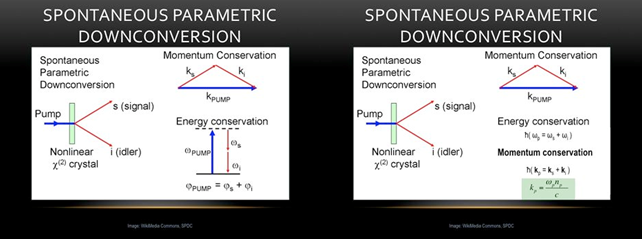
| − | Spontaneous parametric downconversion (SPDC) is a non-linear optical process that takes place with the assistance of specially-engineered optical crystals. These optical crystals are designed with specific index of refraction properties along given crystalline axis. When light of a specific frequency is incident upon the lattice, it will | + | Spontaneous parametric downconversion (SPDC) is a non-linear optical process that takes place with the assistance of specially-engineered optical crystals. These optical crystals are designed with specific index of refraction properties along given crystalline axis. When light of a specific frequency is incident upon the lattice, it will undergo a parametric downconversion process. This will result in an overall "splitting" of one incident light beam into two beams, a "signal" and an "idler" beam, at some well-defined angle with respect to the optical input axis (serving as the zero). The quanta of light will experience a downconversion but within this the momentum and energy of the beam is conserved in the signal and idler beams. See figure 1 for an illustration, below for a simplified explanation, and the WikiPedia article for maximum detail.[http://en.wikipedia.org/wiki/Spontaneous_parametric_down-conversion]. |
| Line 28: | Line 28: | ||
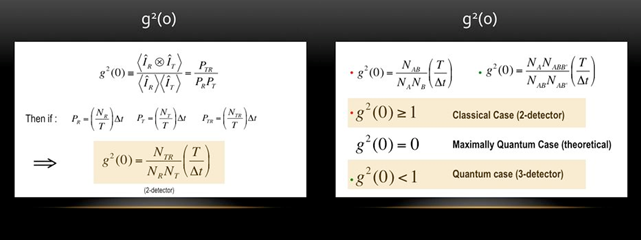
[[File:G2info.png|x350px|thumb|center|Left: Summary of g2 values as a ratio of electric field intensities in a two-detector scheme. (See Beck for relevant details). Right: Summary of g2 values relevant for this experiment]] | [[File:G2info.png|x350px|thumb|center|Left: Summary of g2 values as a ratio of electric field intensities in a two-detector scheme. (See Beck for relevant details). Right: Summary of g2 values relevant for this experiment]] | ||
| + | |||
| + | <p> Because the downconverted photons are produced at (approximately) the same time, and the distance along the path of each photon is equal, the photons generated in the SPDC process will reach the detector at the same time. Therefor, it is useful to count the number of coincidences at the detectors to tell when down conversion happens. The detectors have a 'temporal resolution' of a few nanoseconds. If the photons arrive at detectors A & B within this window, the FPGA designates this event as a coincidence and shows up in labview as an AB count. The speed of light is ~1 foot per nanosecond, so if a coincidence is counted then the arriving photons were spatially separated by less than a few feet. </p> | ||
| + | |||
| + | <p> The single photon state can be determined by adding a beam splitting cube in the path of the signal beam and a third detector placed perpendicular. In the classical view of electromagnetic fields described by Maxwell, the excitations of the field propagate like waves. If this were the case, the excitation along the signal beam would split into two at the PBS and arrive at detectors B AND B' at the same time. </p> | ||
| + | |||
| + | <p> A more accurate view of nature describes the excitations with wavelike and particle like properties. When considering a photon traveling down path B', the photon will choose one discrete direction at the beam splitting cube and arrive at detector B OR B'. </p> | ||
| + | |||
| + | <p> The second order temporal coherence parameter measures the amount of bunching of the photons. Bunching describes photons that arrive grouped together. If we consider a photon that arrives at B, if the photons are bunched the probability of a photon arriving at B' within a very short time window increases. (i.e. they arrive in bunches, so if one arrives then another is probably going to arrive right after that.) If we ignore what is happening at detector A, we see these photons are bunched and the parameter that measures this, G2 is greater than 1 </p> | ||
| + | |||
| + | <p> If we consider the relationship between the coincidences AB & AB', the photons arrive antibunched. We are now detecting the SPDC photon pairs, so the photon in the signal path that corresponds to the photon in the idler path goes to EITHER B OR B'. (The process of using detector A to signal events in the other path is known as heralding, because it is like the photon at detector A is saying, “hear ye, hear ye. A SPDC process occurred and my fellow is in one of the other detectors) Therefor, if an detection happens at AB, it is more likely that the next arrival at AB' will be separated in time. The parameter that measures bunching (G2), is less than one, indicating an antibunched single photon state. </p> | ||
Measurement of photon counts over time at an array of photodetectors can be analyzed for their degree of correlation. Positive, zero, and anti-correlations at the detectors all play a very important role in claiming the nature of the electric field present in the chosen experiment. The constraints on g2 being 0 < g2 ≤ 1 for a quantum mechanical field and g2 ≥ 1 for a classical electric field are determined by analyzing the ratios for the 2-detector and 3-detector schemes for our chosen experiments. To understand this in the context of the experiment, please see the results section. | Measurement of photon counts over time at an array of photodetectors can be analyzed for their degree of correlation. Positive, zero, and anti-correlations at the detectors all play a very important role in claiming the nature of the electric field present in the chosen experiment. The constraints on g2 being 0 < g2 ≤ 1 for a quantum mechanical field and g2 ≥ 1 for a classical electric field are determined by analyzing the ratios for the 2-detector and 3-detector schemes for our chosen experiments. To understand this in the context of the experiment, please see the results section. | ||
| + | |||
| + | == Single Photon Interference and the Polarization Interferometer == | ||
| + | How to align to polarization interferometer: | ||
| + | |||
| + | <p> The B collection lens was displaced 4 mm to the right, coupled to the alignment laser and aligned through two irises set to the level of the BBO crystal. (mainly for the vertical alignment, the irises were placed on the center of the track about 1 & 2 feet from the BBO, so the beam was slightly displaced to the right on the irises.) The tilt of the the BBO was kept constant for the rest of the polarization interferometer. The B lens was then moved to the center of the track and an iris was placed such that the beam passed through the center. </p> | ||
| + | <p> The Beam Displacement Prism (BDP) closer to the collection lens was added to the center of the track. This is the BDP with the picomotor on the horizontal tilt. The BDP transmits one polarization and displaces the other about 4 mm to the right (not to the left like the illustration on the BDP suggests), so the position of the BDP was moved so the beam entered the left half of the calcite. The horizontal and vertical tilt were adjusted to set the surface of the BDP orthogonal to the beam by aligning the back-scattered radiation from the BDP through the center of the iris. The process of adjusting the position of the BDP and aligning the back-scattered radiation was iterated until the beams passed the through the calcite without hitting the mount on the front or back of the BDP. A mount was constructed to keep the red part of the picomotor fixed in place. </p> | ||
| + | <p> The displaced beam (the one on the right) was pointed towards the center of the BBO crystal by adjusting the position of the collection lens orthogonal to the optical axis to pass through the center of two irises placed one and two feet from the BBO. The BDP was checked to make sure the beam passed through without clipping the edges. </p> | ||
| + | <p> A Polarizing Beam Splitting cube (PBS) was placed perpendicular between collection lens B and the third iris. The green sticker was oriented toward detector B. One of the beams emerging from the BDP appeared much lighter due to the PBS decreasing the intensity of one of the beams. A half wave plate set to 22.5° was added between the iris and the BDP to rotate the polarization 45°. The half wave plate was placed perpendicular to the alignment beam. </p> | ||
| + | <p> A half wave plate rotated 45° was placed perpendicular to the beams behind the BDP to change the polarization of each beam by 90°. This was done so the path length difference would be approximately equal when the beams converge in the second BDP. </p> | ||
| + | <p> A BDP placed in a kinematic mount was added behind the second half wave plate to make the beams converge. The beams passed through the BDP with minimal clipping on both sides and aligned parallel to the other BDP by making the back-scattered radiation pass through the center of the iris closest to the collection lens. A third half wave plate was added after the BDP and set to 22.5° to rotate the polarization another 45°, so the beam entering and exiting the polarizer would shifted a total of 180°. </p> | ||
| + | <p> An interference pattern was observed with the alignment laser by placing a horizontal polarizer and screen between the BBO & half wave plate. The horizontal tilt of the BDP closest to the collection lens was adjusted with a picomotor to observe interference on the screen. The size of the fringes were comparable to the spot size of the beam, so it was difficult to observe the interference unless the tilt was varied. The picomotor was used to make a darker spot on the screen and the contrast was maximized by slightly changing the angle (on the order of a few degrees) of each half wave plate such that the intensity on the dark fringe was minimized. </p> | ||
| + | <p> The alignment laser was disconnected from B and connected to B'. The B' detector was translated parallel to the signal beam to make the alignment laser go through the iris between the PBS and polarizing interferometer. The horizontal and vertical tilt of the collection lens were adjusted to make the alignment laser go through the interferometer. This process was iterated until the beam passed through the center of all three irises. </p> | ||
| + | <p> With the lights out, FPGA, violet laser, SPCM, and labview running, the horizontal tilt of the BDP closer to the collection lenses was slowly adjusted with a picomotor. Interference was not observed, so the angle of the 45 degree half wave plate (with respect to the signal beam) was adjusted to make sure it was perpendicular to the signal beam, and the orientation angle of the BDP closer to the BBO was varied by a degree at a time, scanning over the horizontal range each time. When interference was observed, the BDP closer to the collection lens was rotated to 355°, while the BDP closer to the BBO was near 2°. </p> | ||
| + | |||
| + | == Double Slit and the Quantum Eraser == | ||
= Experimental Setup = | = Experimental Setup = | ||
| + | |||
| + | == Basic Setup == | ||
In our experiment we start with a 405nm blue diode pump laser. We then put the laser through an iris and a linear polarizer to ensure horizontal polarization. Once through the polarizer the laser was then pushed through a half wave plate in order to change the polarization of the beam to vertical. After being reflected off of two mirrors the light is incident on the downconversion crystal, producing two 810nm horizontally polarized output beams (signal and idler). A beam blocker was placed down the beam path to block any stray 405nm light. The two output beams travel at an angle of roughly 3 degrees off axis with respect to the input beam. The signal and idler beams travel down their respective legs and reach a photodetector to record both their individual and coincidence counts. Coincidence at the B and B' detectors is determined via a polarizing beam-splitting cube (PBSC) designed for 810nm light. The photodetectors are multi-mode fiber-coupled to a FPGA board and the outputs are sent to a custom LabView counting program (Coincidence.vi or Angle Scan.vi) on a desktop computer setup right on the optics table. | In our experiment we start with a 405nm blue diode pump laser. We then put the laser through an iris and a linear polarizer to ensure horizontal polarization. Once through the polarizer the laser was then pushed through a half wave plate in order to change the polarization of the beam to vertical. After being reflected off of two mirrors the light is incident on the downconversion crystal, producing two 810nm horizontally polarized output beams (signal and idler). A beam blocker was placed down the beam path to block any stray 405nm light. The two output beams travel at an angle of roughly 3 degrees off axis with respect to the input beam. The signal and idler beams travel down their respective legs and reach a photodetector to record both their individual and coincidence counts. Coincidence at the B and B' detectors is determined via a polarizing beam-splitting cube (PBSC) designed for 810nm light. The photodetectors are multi-mode fiber-coupled to a FPGA board and the outputs are sent to a custom LabView counting program (Coincidence.vi or Angle Scan.vi) on a desktop computer setup right on the optics table. | ||
| Line 37: | Line 64: | ||
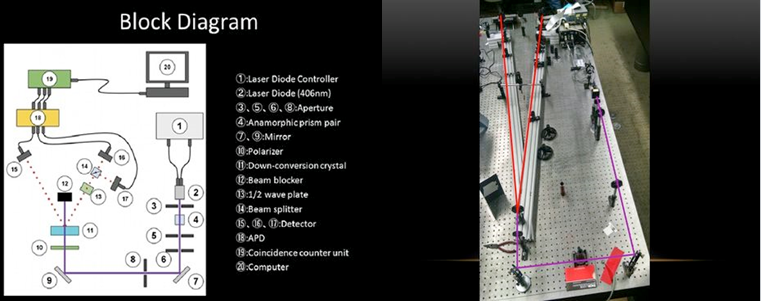
[[File:Diagram.png|x350px|thumb|center|'''Left:''' block diagram of SPDC experiment (some optics not included in all experiments). '''Right:''' Optics table overview. Purple beam = 405nm input, Red beams = 810 DC outputs.]] | [[File:Diagram.png|x350px|thumb|center|'''Left:''' block diagram of SPDC experiment (some optics not included in all experiments). '''Right:''' Optics table overview. Purple beam = 405nm input, Red beams = 810 DC outputs.]] | ||
| + | |||
| + | |||
| + | == Quantum Eraser Setup == | ||
| + | We continued to use the basic setup described above, ensuring that we used a double layered BBO that produces entangled photons. Note that a single layered BBO does not produce entanglement, which is required for the quantum eraser experiment. Down the signal leg, between the downconversion crystal and the PBSC, we installed our interferometer, which included in order, a half-wave plate set to 22.5 degrees, a beam displacement prism (BDP), a half-wave plate set to 45 degrees, another BDP, oriented oppositely in order to recombine the light beams, and finally another half-wave plate set to either 22.5 or zero degrees, depending on the stage of the experiment. <br /> | ||
| + | We followed the procedure described in Beck's book to install and align the interferometer. One important note is to calibrate and set all of the wave plates independently of this installation. The fast axes are not always truly aligned how they are marked, and their alignment must be empirically and accurately determined before their use in the interferometer. <br /> | ||
| + | After the interferometer was properly aligned, we verified that it produced interference by setting the third waveplate to our empirically found 22.5 degrees and scanning the path lengths with the picomotor, plotting coincidence counts as a function of time. Proper interference was observed when we saw coincidence counts between AB and AB' oscilate in opposition of each other. <br /> | ||
| + | We were not able to complete the rest of the quantum eraser experiment for various reasons, but our suggested procedure is as follows: Set the third waveplate to zero degrees instead of 22.5. This should provide "which-path" information and interrupt the interference pattern. Then insert a quarter-wave plate into the idler leg. Entanglement should ensure that the "which-path" information is erased, and the interference pattern should reappear. | ||
= Results = | = Results = | ||
| Line 60: | Line 94: | ||
| − | For a three-detector scheme, coincidence counts are a result of anti-correlated measurements on a single-photon field across detectors A, B, and B'. Single photons incident on the PBSC have a 50% probability of reflection or transmission at the PBSC refraction face. When analyzing the AB and AB' coincidence counts, one would expect at least one of these values to be ''exactly zero'' when considering a single photon source - the photon will only be incident on ''either'' the B or B' detector, not both. | + | For a three-detector scheme, coincidence counts are a result of anti-correlated measurements on a single-photon field across detectors A, B, and B'. Single photons incident on the PBSC have a 50% probability of reflection or transmission at the PBSC refraction face. When analyzing the AB and AB' coincidence counts, one would expect at least one of these values to be ''exactly zero'' when considering a ''perfect'' single photon source - the photon will only be incident on ''either'' the B or B' detector, not both. Since this is not achievable in the lab, the value can approach zero but will never reach it. However, it should ''never'' breach 1 for a quantum mechanical effect to be claim. Our scheme then yields a measurable value of 0 < g2 ≤ 1 by virtue of the ratios outlined above. Our results show an average value of g2 approximately 0.235: |
[[File:g2_3det.png|x350px|thumb|center|3-detector measurement of g2 with appropriate error. Note that each data point is an average value of 100 points. Average value of g2 0.235 ± 0.081 with maximum error ±0.052]] | [[File:g2_3det.png|x350px|thumb|center|3-detector measurement of g2 with appropriate error. Note that each data point is an average value of 100 points. Average value of g2 0.235 ± 0.081 with maximum error ±0.052]] | ||
For the next part of our experiment we added the third detector (B') and the polarizing beam splitting cube as described above. In this part we did a coincidence count between sensor A from the signal beam and sensor B from the idler beam from here we then were able record the g2 number for the two detector case. In this case we got a number greater than one which then solidifies the fact of light having a classical characteristic about it. We then proceeded to take a 3-detector coincidence count in order to look at the g2 number. From here we then took recordings from the B' sensor on the idler beam. This then allowed us to get an ABB' coincidence count. Here we got a value much less than one, which in our case as described above gives us that light has quantum characteristics to it. This then tells us that light is composed of particles and these particles are called photons. This experiment gives us a certainty to the existence of photons but not only that, it expressly shows that of which Thomas Young found in his famous nineteenth century experiment commonly called Young's experiment, which is that light has characteristics of both waves and particles. | For the next part of our experiment we added the third detector (B') and the polarizing beam splitting cube as described above. In this part we did a coincidence count between sensor A from the signal beam and sensor B from the idler beam from here we then were able record the g2 number for the two detector case. In this case we got a number greater than one which then solidifies the fact of light having a classical characteristic about it. We then proceeded to take a 3-detector coincidence count in order to look at the g2 number. From here we then took recordings from the B' sensor on the idler beam. This then allowed us to get an ABB' coincidence count. Here we got a value much less than one, which in our case as described above gives us that light has quantum characteristics to it. This then tells us that light is composed of particles and these particles are called photons. This experiment gives us a certainty to the existence of photons but not only that, it expressly shows that of which Thomas Young found in his famous nineteenth century experiment commonly called Young's experiment, which is that light has characteristics of both waves and particles. | ||
| + | |||
| + | == Group 3.1: Alex Schachtner, Kevin Masson, Tyler Anderton == | ||
| + | |||
| + | |||
| + | |||
| + | === Quantum Eraser === | ||
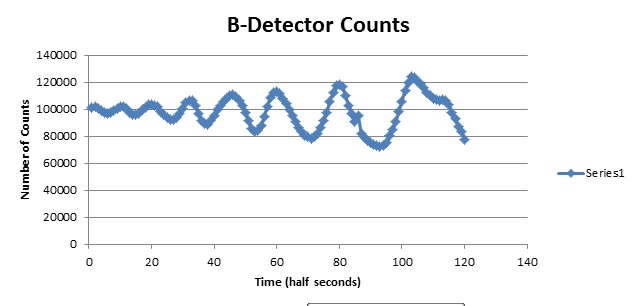
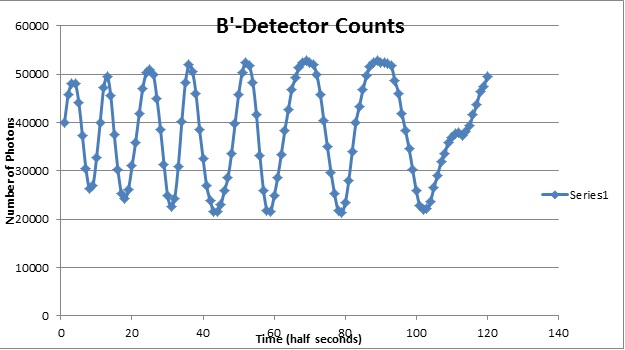
| + | Here is where we actually set up the experiment to determine certain characteristics of light, namely the concept of entanglement. We started by placing the interferometer into the signal leg of the system that we had already had in place. We followed the procedure lined up in the Beck book but we still found it to be an incredibly difficult task to align the interferometer correctly. We broke the whole procedure down and found that both the B and B' sensors should be placed on translation stages for easier access. It takes a very large amount of patient in order to setup and odds are since this is on such a small scale that you will have to repeat the procedure many times in order to see any sort of intrference pattern by altering one of the Beam Displacing Prisms (BDPs) and watching the spot get brighter and dimmer as the angle changes. Once properly aligned the alignment laser can be taken out of the setup and then the actual laser diode can be turned on (after lights out procedure) and then you can view the interference pattern that was visually seen now by the photon counts. they should gradually fluctuate such as what is shown below. If properly aligned the B and B' counts should be symmetrical but some issues arose and the interferometer was not competely aligned. | ||
| + | |||
| + | [[File:Bcounts.jpg|x350px|thumb|center|alt=B detector counts.|]] | ||
| + | |||
| + | [[File:B'counts.jpg|x350px|thumb|center|alt=B' detector counts.|]] | ||
| + | |||
| + | Sadly were not able to get past this part since we had too many complications and so we are now just going to talk theory rather than what we have done experimentally. Here is where we would have placed a polarized into the idler leg and if the system would work properly we would be able to see the photon counts on the B and B'sensors to fluctuate and then this wold show that at certain polarizations of the A sensor the B and B' sensors would be minimum showing the fact that even when the photons are not in contact they are still able to communicate and thus they are constantly entangled, expressly showing the theory of quantum entanglement. | ||
| + | |||
| + | [[SRS Photon Counter]] | ||
= External Resources = | = External Resources = | ||
Latest revision as of 14:23, 8 November 2021
Contents
Quantum Optics and Spontaneous Parametric Downconversion
The goal of this project is to use a series of table-top laser-based optics experiments to investigate various quantum mechanical phenomena. These include, but are not limited to: quantization of the electric field (proof of the existence of photons), single-photon interference, violation of Bell inequalities, and quantum information measurements.
Physics Background
Overview
Spontaneous parametric downconversion (SPDC) is a non-linear optical process that takes place with the assistance of specially-engineered optical crystals. These optical crystals are designed with specific index of refraction properties along given crystalline axis. When light of a specific frequency is incident upon the lattice, it will undergo a parametric downconversion process. This will result in an overall "splitting" of one incident light beam into two beams, a "signal" and an "idler" beam, at some well-defined angle with respect to the optical input axis (serving as the zero). The quanta of light will experience a downconversion but within this the momentum and energy of the beam is conserved in the signal and idler beams. See figure 1 for an illustration, below for a simplified explanation, and the WikiPedia article for maximum detail.[1].
Downconversion
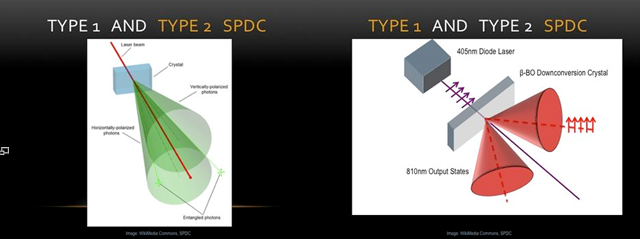
If we reduce the incident beam to a series of single photons, whose existence is a central postulate of quantum theory, the above description need only be slightly altered. A single photon incident on the crystalline lattice has a certain probability of being downconverted via the interaction with the lattice (roughly 1 in 10^12)[2]. When this conversion takes place, the single photon, with its inherent polarization properties, is converted into a pair of polarization entangled photons at half the energy and wavelength. The output pair has the same polarization, but is polarized orthogonal to the input beam. Type II follows the same characteristic downconversion (DC) as the Type I but with one very crucial difference. In Type II downconversion the polarizations of the output beams are now orthogonal to one another (with some overlap in their respective electric fields so that there is a possibility for photon interaction, and unlike that of Type I where there is no possibility for interaction after the downconversion crystal). The way one sets their experiment for Type I or Type II downconversion is by choosing the correct the crystal lattice cut (i.e. purchasing the correct crystal). The lattice will be cut in such a way that the axis with varying indices of refraction will favor one DC type over the other.
Single Photon Fields and g2
NOTE: This section heavily references from Mark Beck's text Quantum Mechanics: Theory and Experiment which is mentioned in the references and available in the lab.
In any optics experiment the experimenters usually convert light to electric current via some photodetector and diode scheme. If one wishes to measure single photons, the question must then arise - how could you distinguish the "granularity" of a single photon incident on your detector from that of the single electrons flowing in your electrical detection scheme? Fortunately there exists a way to quantize the electric field incident on the detector that circumvents this issue entirely. The quantization of the electric field will not be presented in detail here, nor will the derivation of the g2 values. These details can be found in section 16 of Beck.
For ease of presentation, it should suffice to say that the g2 factor (degree of second-order coherence) is a numerical value describing the ratio of intensities between two electric fields. This ratio can be cleverly mainpulated, after the coherent electric field from a laser source has been properly quantized, to yield detection probabilities in different regions of space. These probabilities can then be averaged over time to yield estimates for the number of photons one would expect to be incident upon a detector placed in the region of the field. Below are the most basic depictions of these values. For more detail, see the WikiPedia page [3] .
Because the downconverted photons are produced at (approximately) the same time, and the distance along the path of each photon is equal, the photons generated in the SPDC process will reach the detector at the same time. Therefor, it is useful to count the number of coincidences at the detectors to tell when down conversion happens. The detectors have a 'temporal resolution' of a few nanoseconds. If the photons arrive at detectors A & B within this window, the FPGA designates this event as a coincidence and shows up in labview as an AB count. The speed of light is ~1 foot per nanosecond, so if a coincidence is counted then the arriving photons were spatially separated by less than a few feet.
The single photon state can be determined by adding a beam splitting cube in the path of the signal beam and a third detector placed perpendicular. In the classical view of electromagnetic fields described by Maxwell, the excitations of the field propagate like waves. If this were the case, the excitation along the signal beam would split into two at the PBS and arrive at detectors B AND B' at the same time.
A more accurate view of nature describes the excitations with wavelike and particle like properties. When considering a photon traveling down path B', the photon will choose one discrete direction at the beam splitting cube and arrive at detector B OR B'.
The second order temporal coherence parameter measures the amount of bunching of the photons. Bunching describes photons that arrive grouped together. If we consider a photon that arrives at B, if the photons are bunched the probability of a photon arriving at B' within a very short time window increases. (i.e. they arrive in bunches, so if one arrives then another is probably going to arrive right after that.) If we ignore what is happening at detector A, we see these photons are bunched and the parameter that measures this, G2 is greater than 1
If we consider the relationship between the coincidences AB & AB', the photons arrive antibunched. We are now detecting the SPDC photon pairs, so the photon in the signal path that corresponds to the photon in the idler path goes to EITHER B OR B'. (The process of using detector A to signal events in the other path is known as heralding, because it is like the photon at detector A is saying, “hear ye, hear ye. A SPDC process occurred and my fellow is in one of the other detectors) Therefor, if an detection happens at AB, it is more likely that the next arrival at AB' will be separated in time. The parameter that measures bunching (G2), is less than one, indicating an antibunched single photon state.
Measurement of photon counts over time at an array of photodetectors can be analyzed for their degree of correlation. Positive, zero, and anti-correlations at the detectors all play a very important role in claiming the nature of the electric field present in the chosen experiment. The constraints on g2 being 0 < g2 ≤ 1 for a quantum mechanical field and g2 ≥ 1 for a classical electric field are determined by analyzing the ratios for the 2-detector and 3-detector schemes for our chosen experiments. To understand this in the context of the experiment, please see the results section.
Single Photon Interference and the Polarization Interferometer
How to align to polarization interferometer:
The B collection lens was displaced 4 mm to the right, coupled to the alignment laser and aligned through two irises set to the level of the BBO crystal. (mainly for the vertical alignment, the irises were placed on the center of the track about 1 & 2 feet from the BBO, so the beam was slightly displaced to the right on the irises.) The tilt of the the BBO was kept constant for the rest of the polarization interferometer. The B lens was then moved to the center of the track and an iris was placed such that the beam passed through the center.
The Beam Displacement Prism (BDP) closer to the collection lens was added to the center of the track. This is the BDP with the picomotor on the horizontal tilt. The BDP transmits one polarization and displaces the other about 4 mm to the right (not to the left like the illustration on the BDP suggests), so the position of the BDP was moved so the beam entered the left half of the calcite. The horizontal and vertical tilt were adjusted to set the surface of the BDP orthogonal to the beam by aligning the back-scattered radiation from the BDP through the center of the iris. The process of adjusting the position of the BDP and aligning the back-scattered radiation was iterated until the beams passed the through the calcite without hitting the mount on the front or back of the BDP. A mount was constructed to keep the red part of the picomotor fixed in place.
The displaced beam (the one on the right) was pointed towards the center of the BBO crystal by adjusting the position of the collection lens orthogonal to the optical axis to pass through the center of two irises placed one and two feet from the BBO. The BDP was checked to make sure the beam passed through without clipping the edges.
A Polarizing Beam Splitting cube (PBS) was placed perpendicular between collection lens B and the third iris. The green sticker was oriented toward detector B. One of the beams emerging from the BDP appeared much lighter due to the PBS decreasing the intensity of one of the beams. A half wave plate set to 22.5° was added between the iris and the BDP to rotate the polarization 45°. The half wave plate was placed perpendicular to the alignment beam.
A half wave plate rotated 45° was placed perpendicular to the beams behind the BDP to change the polarization of each beam by 90°. This was done so the path length difference would be approximately equal when the beams converge in the second BDP.
A BDP placed in a kinematic mount was added behind the second half wave plate to make the beams converge. The beams passed through the BDP with minimal clipping on both sides and aligned parallel to the other BDP by making the back-scattered radiation pass through the center of the iris closest to the collection lens. A third half wave plate was added after the BDP and set to 22.5° to rotate the polarization another 45°, so the beam entering and exiting the polarizer would shifted a total of 180°.
An interference pattern was observed with the alignment laser by placing a horizontal polarizer and screen between the BBO & half wave plate. The horizontal tilt of the BDP closest to the collection lens was adjusted with a picomotor to observe interference on the screen. The size of the fringes were comparable to the spot size of the beam, so it was difficult to observe the interference unless the tilt was varied. The picomotor was used to make a darker spot on the screen and the contrast was maximized by slightly changing the angle (on the order of a few degrees) of each half wave plate such that the intensity on the dark fringe was minimized.
The alignment laser was disconnected from B and connected to B'. The B' detector was translated parallel to the signal beam to make the alignment laser go through the iris between the PBS and polarizing interferometer. The horizontal and vertical tilt of the collection lens were adjusted to make the alignment laser go through the interferometer. This process was iterated until the beam passed through the center of all three irises.
With the lights out, FPGA, violet laser, SPCM, and labview running, the horizontal tilt of the BDP closer to the collection lenses was slowly adjusted with a picomotor. Interference was not observed, so the angle of the 45 degree half wave plate (with respect to the signal beam) was adjusted to make sure it was perpendicular to the signal beam, and the orientation angle of the BDP closer to the BBO was varied by a degree at a time, scanning over the horizontal range each time. When interference was observed, the BDP closer to the collection lens was rotated to 355°, while the BDP closer to the BBO was near 2°.
Double Slit and the Quantum Eraser
Experimental Setup
Basic Setup
In our experiment we start with a 405nm blue diode pump laser. We then put the laser through an iris and a linear polarizer to ensure horizontal polarization. Once through the polarizer the laser was then pushed through a half wave plate in order to change the polarization of the beam to vertical. After being reflected off of two mirrors the light is incident on the downconversion crystal, producing two 810nm horizontally polarized output beams (signal and idler). A beam blocker was placed down the beam path to block any stray 405nm light. The two output beams travel at an angle of roughly 3 degrees off axis with respect to the input beam. The signal and idler beams travel down their respective legs and reach a photodetector to record both their individual and coincidence counts. Coincidence at the B and B' detectors is determined via a polarizing beam-splitting cube (PBSC) designed for 810nm light. The photodetectors are multi-mode fiber-coupled to a FPGA board and the outputs are sent to a custom LabView counting program (Coincidence.vi or Angle Scan.vi) on a desktop computer setup right on the optics table.
Quantum Eraser Setup
We continued to use the basic setup described above, ensuring that we used a double layered BBO that produces entangled photons. Note that a single layered BBO does not produce entanglement, which is required for the quantum eraser experiment. Down the signal leg, between the downconversion crystal and the PBSC, we installed our interferometer, which included in order, a half-wave plate set to 22.5 degrees, a beam displacement prism (BDP), a half-wave plate set to 45 degrees, another BDP, oriented oppositely in order to recombine the light beams, and finally another half-wave plate set to either 22.5 or zero degrees, depending on the stage of the experiment.
We followed the procedure described in Beck's book to install and align the interferometer. One important note is to calibrate and set all of the wave plates independently of this installation. The fast axes are not always truly aligned how they are marked, and their alignment must be empirically and accurately determined before their use in the interferometer.
After the interferometer was properly aligned, we verified that it produced interference by setting the third waveplate to our empirically found 22.5 degrees and scanning the path lengths with the picomotor, plotting coincidence counts as a function of time. Proper interference was observed when we saw coincidence counts between AB and AB' oscilate in opposition of each other.
We were not able to complete the rest of the quantum eraser experiment for various reasons, but our suggested procedure is as follows: Set the third waveplate to zero degrees instead of 22.5. This should provide "which-path" information and interrupt the interference pattern. Then insert a quarter-wave plate into the idler leg. Entanglement should ensure that the "which-path" information is erased, and the interference pattern should reappear.
Results
Group 3: Kevin Masson and Alex Schachtner
Maximizing Photon Counts
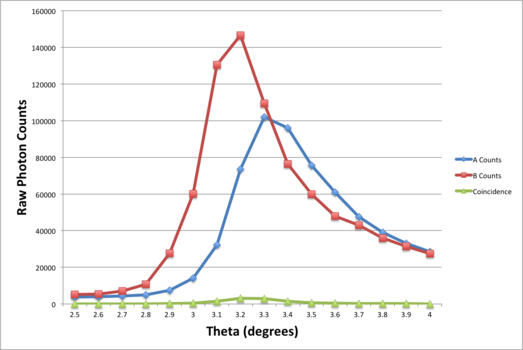
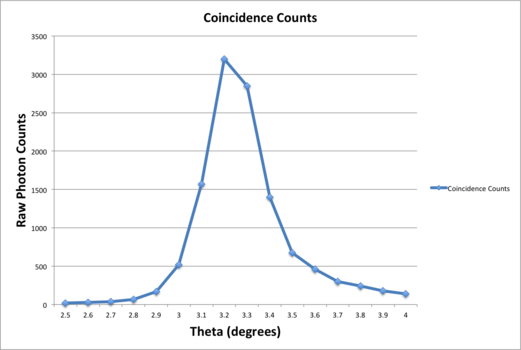
In order to have the best possible experimental results, we sought to maximize the photon counts on each optical leg of the experiment. To do this, we varied the angle of each optical leg from 2.5 degrees to 4 degrees by increments of one-tenth of a degree from the central axis. Recorded values of photon counts are shown below. We found that the maximum counts occurred at approximately 3.2 degrees. This matches the theoretical maximum angle for photon counts of 3 degrees.
Proving the Existence of Individual Photons
Measurement of individual photons is done in this experiment via determining the g2 value referenced in the background section. Two measurements were devised for comparison of their resultant values - a two-detector measurement for illustrating the classical electric field value of g2, and a three-detector measurement for verifying the quantized electromagnetic field.
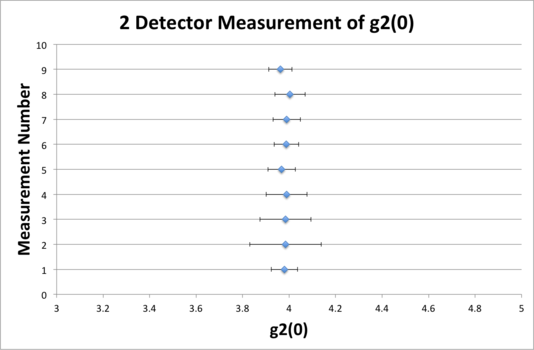
For a two-detector scheme, coincidence counts are seen as a result of positively-correlated or non-correlated measurements of a single input electric field being split by the polarizing beam-splitting cube (PBSC). If one pictures the electric field incidence on a refractive crystal, they expect the outputs at subsequent faces to be phase-shifted copies of the input field. This is purely a classical electrodynamic effect - polarized EM plane waves incident on the PBSC become phase-shifted polarized plane waves when re-emitted. g2 measurements at the B and B' detector show these results by expecting g2 ≥ 1 in the mathematical scheme outlined above. Our results indeed show g2 approximately 3.9 for this measurement:
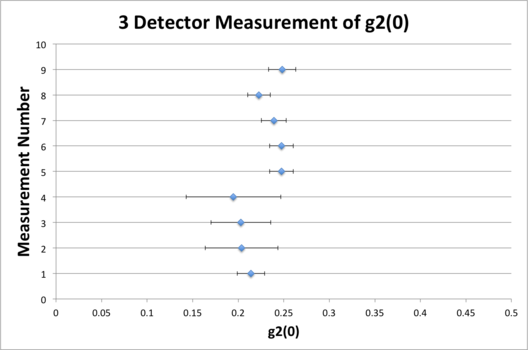
For a three-detector scheme, coincidence counts are a result of anti-correlated measurements on a single-photon field across detectors A, B, and B'. Single photons incident on the PBSC have a 50% probability of reflection or transmission at the PBSC refraction face. When analyzing the AB and AB' coincidence counts, one would expect at least one of these values to be exactly zero when considering a perfect single photon source - the photon will only be incident on either the B or B' detector, not both. Since this is not achievable in the lab, the value can approach zero but will never reach it. However, it should never breach 1 for a quantum mechanical effect to be claim. Our scheme then yields a measurable value of 0 < g2 ≤ 1 by virtue of the ratios outlined above. Our results show an average value of g2 approximately 0.235:
For the next part of our experiment we added the third detector (B') and the polarizing beam splitting cube as described above. In this part we did a coincidence count between sensor A from the signal beam and sensor B from the idler beam from here we then were able record the g2 number for the two detector case. In this case we got a number greater than one which then solidifies the fact of light having a classical characteristic about it. We then proceeded to take a 3-detector coincidence count in order to look at the g2 number. From here we then took recordings from the B' sensor on the idler beam. This then allowed us to get an ABB' coincidence count. Here we got a value much less than one, which in our case as described above gives us that light has quantum characteristics to it. This then tells us that light is composed of particles and these particles are called photons. This experiment gives us a certainty to the existence of photons but not only that, it expressly shows that of which Thomas Young found in his famous nineteenth century experiment commonly called Young's experiment, which is that light has characteristics of both waves and particles.
Group 3.1: Alex Schachtner, Kevin Masson, Tyler Anderton
Quantum Eraser
Here is where we actually set up the experiment to determine certain characteristics of light, namely the concept of entanglement. We started by placing the interferometer into the signal leg of the system that we had already had in place. We followed the procedure lined up in the Beck book but we still found it to be an incredibly difficult task to align the interferometer correctly. We broke the whole procedure down and found that both the B and B' sensors should be placed on translation stages for easier access. It takes a very large amount of patient in order to setup and odds are since this is on such a small scale that you will have to repeat the procedure many times in order to see any sort of intrference pattern by altering one of the Beam Displacing Prisms (BDPs) and watching the spot get brighter and dimmer as the angle changes. Once properly aligned the alignment laser can be taken out of the setup and then the actual laser diode can be turned on (after lights out procedure) and then you can view the interference pattern that was visually seen now by the photon counts. they should gradually fluctuate such as what is shown below. If properly aligned the B and B' counts should be symmetrical but some issues arose and the interferometer was not competely aligned.
Sadly were not able to get past this part since we had too many complications and so we are now just going to talk theory rather than what we have done experimentally. Here is where we would have placed a polarized into the idler leg and if the system would work properly we would be able to see the photon counts on the B and B'sensors to fluctuate and then this wold show that at certain polarizations of the A sensor the B and B' sensors would be minimum showing the fact that even when the photons are not in contact they are still able to communicate and thus they are constantly entangled, expressly showing the theory of quantum entanglement.
External Resources
Mark Beck's Page, Whitman College
References
1.) Beck, M. Quantum Mechanics: Theory and Experiment. 2011. Wiley & Sons. [4]
2.) S. P. Walborn, M. O. Terra Cunha, S. Padua, A Double-Slit Quantum Eraser Physical Review A, (65, 033818, 2002).
Original Authors of this page are Alex Schachtner and Kevin Masson. First devised March, 2015.
